Al-Hagri Dashboard
تفاصيل العمل
تنويه هام: "هذه البيانات غير حقيقية هي فقط مجرد محاكاة لنظام وسيستم الشركة وليس لها اي صلة تماما ببيانات الشركة"
صيانة المدارس مش مجرد مقشة ومساحة! تعالوا نشوف إزاي بتدار عمليات النظافة في مئات المدارس بداشبورد واحدة
الداشبورد دي نموذج عملي وممتاز جداً، لأنها بتلخص تشغيل يومي وعمليات على الأرض لشركة اسمها "الهاجري" مسؤولة عن صيانة ونظافة المدارس.
تعالوا نقرأ الأرقام دي بتقول إيه للإدارة:
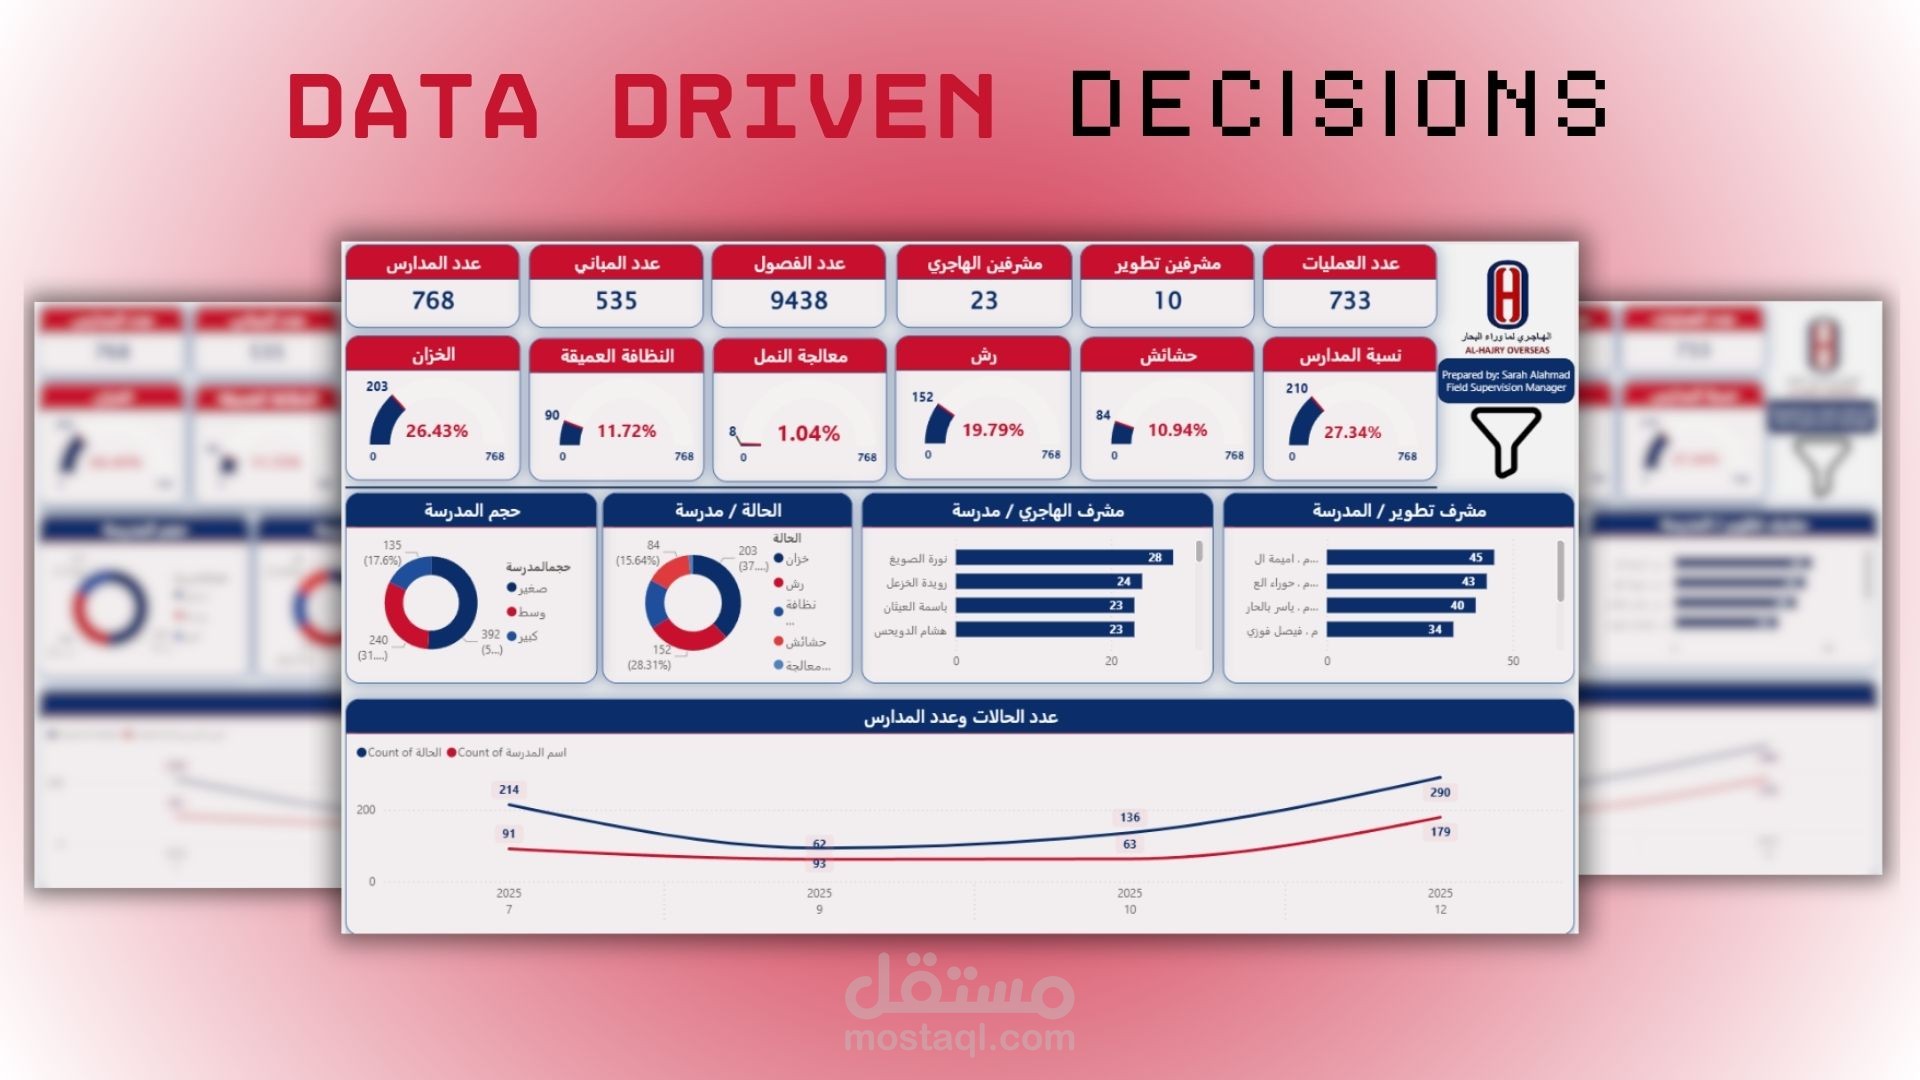
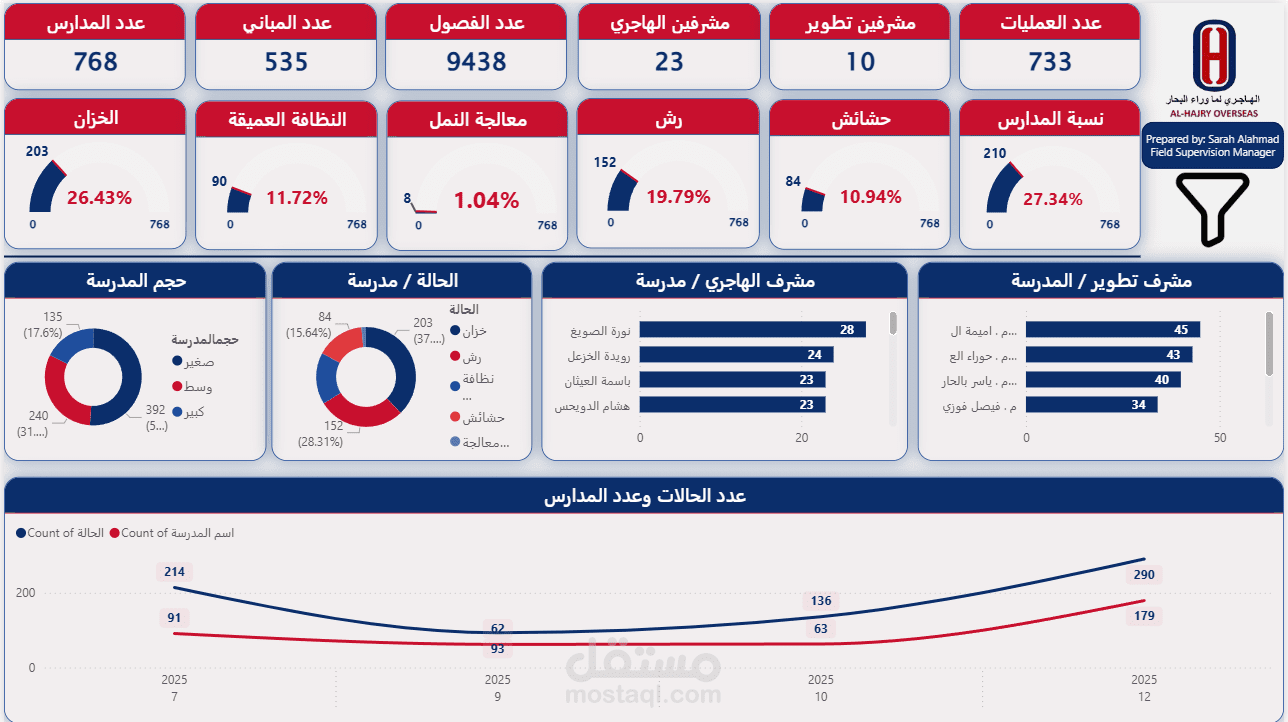
حجم الشغل (الخلاصة من فوق): الإدارة هنا عينها على سكيل كبير؛ الشركة شايلة مسؤولية 768 مدرسة، فيهم 535 مبنى، وأكتر من 9 آلاف فصل! كل ده بيتدير بـ 733 عملية تشغيل، وبيتابعهم فريق من 33 مشرف (متقسمين بين مشرفين من الشركة ومشرفين تطوير).
إيه أكتر شغل بيطلب؟ (العدادات): مؤشرات القياس اللي في النص دي بتجيب الخلاصة. أكتر حاجة شاغلة بالهم وبتاخد مجهود هي صيانة "الخزانات" (حوالي 26% من الشغل)، وبعدها أعمال "الرش" ومكافحة الحشرات (حوالي 20%). وفي الجنب التاني، "معالجة النمل" دي أقل حاجة بتطلب (يا دوب 1%).
المدارس والمشرفين: رسمة الدونات (الدائرة) بتقولنا إن أغلب المدارس اللي بيشتغلو فيها حجمها "كبير" (392 مدرسة). والعواميد اللي جنبها عاملة زي "لوحة شرف" أو تقييم أداء بتبين أسامي المشرفين (زي نورة وباسمة) ومين فيهم ماسك مدارس وعمليات أكتر.
مواسم الزحمة (الخط الزمني): الرسمة اللي تحت خالص دي أهم حاجة في التخطيط. بتورينا الشغل بيزيد إمتى وبيقل إمتى. واضح جداً إن الشغل بيضرب في العالي في شهر 7 (عز الصيف والإجازة) وشهر 12، وده منطقي جداً عشان يعملوا النظافة العميقة والصيانة ويجهزوا المدارس للترم الجديد من غير ما يزعجوا الطلبة.
Overview:
This dashboard by "Al-Hajry Overseas" is a brilliant example of tracking field operations and facility management.
Here is the story the data tells us:
The Scale of Operations: The top row sets the massive scale of the project. The company is managing operations across 768 schools, encompassing 535 buildings and over 9,400 classrooms! All of this is monitored through 733 active operations and overseen by a team of 33 field supervisors.
Where is the Effort Going? (The Gauges): The semi-circle dials show management exactly what type of maintenance is in demand. "Tank" maintenance (likely water tanks) takes the lead at 26.4%, followed closely by "Spraying" or pest control (19.8%). Deep cleaning and weed control also take up a fair chunk, while ant treatment is practically non-existent at 1%.
School Sizes & Top Performers: The pie charts reveal that the majority of the schools they service are categorized as "Large" (392 out of the total). The horizontal bar charts act as a performance tracker, showing exactly which supervisors are handling the highest volume of schools.
The Seasonality Trend: The line chart at the bottom is crucial for HR and resource planning. It shows clear spikes in case volumes and school visits during July (summer break) and December (winter break). This tells the management exactly when they need to ramp up their inventory and field staff to prepare the schools for the upcoming semesters.