El-Noor Specialist Hospital Dashboard
تفاصيل العمل

تنويه هام: "هذه البيانات غير حقيقية هي فقط مجرد محاكاة لنظام وسيستم الشركة وليس لها اي صلة تماما ببيانات الشركة"
نبض الأرقام داخل العناية المركزة: كيف تُدار حياة أو موت المرضى بالبيانات؟
المرة دي إحنا دخلنا أروقة أكتر مكان حساس في "مستشفى النور التخصصي".. العناية المركزة (ICU). الداشبورد دي مش مجرد أرقام عادية، دي بتعكس حالات حرجة وحياة ناس، والهدف منها إن الإدارة تفهم إيه اللي بيحصل بالظبط عشان تحسن الرعاية وتقلل نسب الوفيات.
تعالوا نقرأ الأرقام دي بتقول إيه:
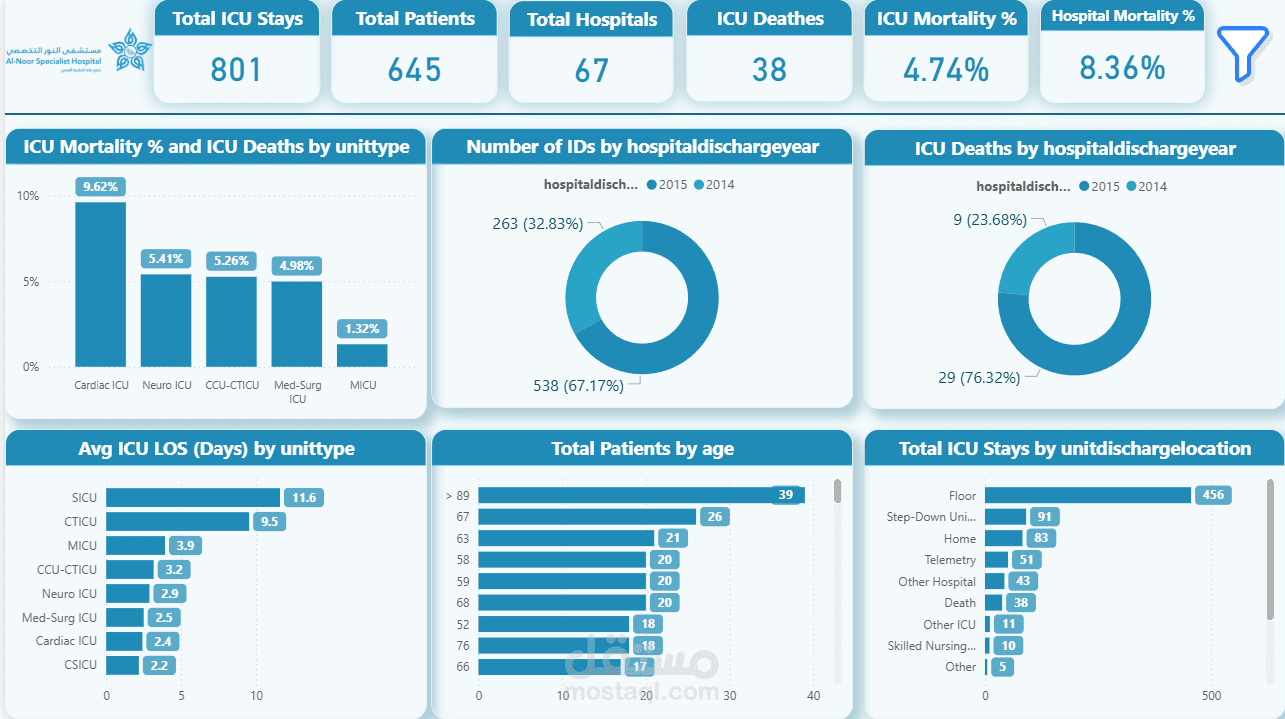
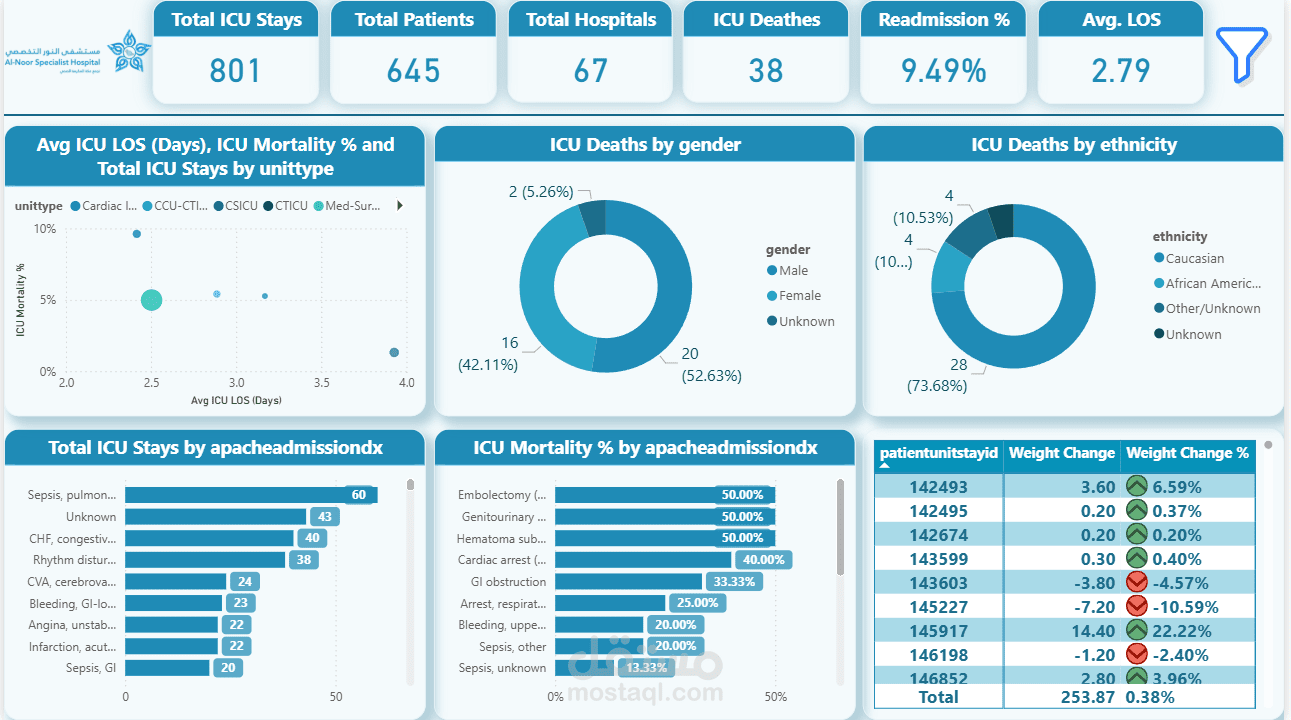
النظرة العامة (الخلاصة): المستشفى استقبلت 801 حالة دخول للعناية المركزة، لـ 645 مريض. نسبة الوفيات جوة العناية (ICU Mortality) حوالي 4.74%، ونسبة رجوع المريض للعناية تاني بعد ما خرج منها (Readmission) حوالي 9.49%. الأرقام دي هي الترمومتر اللي بيقيس كفاءة الدكاترة والرعاية.
فين أخطر مكان في العناية؟: لو ركزنا في الرسمة بتاعة نسب الوفيات، هنلاقي إن "عناية القلب" (Cardiac ICU) هي اللي فيها أعلى نسبة وفيات (9.62%)، ودي إشارة للإدارة إن القسم ده محتاج تركيز، دعم، أو يمكن أجهزة متطورة أكتر لإن حالاته هي الأصعب.
المرضى بيقعدوا كام يوم؟: في المتوسط، المريض بيقعد في العناية حوالي 3 أيام (2.79 يوم). بس "العناية الجراحية" (SICU) هي أكتر مكان المريض بيطول فيه، بيوصل لـ 11 يوم ونص!
مين بيدخل العناية وليه؟: الرسوم البيانية بتقولنا إن كبار السن (اللي فوق 89 سنة) هما الفئة الأكبر في العناية. ولما نيجي نشوف الأسباب، هنلاقي إن "تسمم الدم الرئوي" (Sepsis, pulmonary) هو المتصدر كأكتر سبب بيدخل الناس العناية المركزة.
الأخبار الحلوة (بعد العناية): رسمة (Total ICU Stays by unit discharge location) بتطمنا، لإنها بتبين إن الأغلبية الساحقة من المرضى (456 حالة) حالتهم بتستقر وبيخرجوا من العناية لـ "غرف عادية" في المستشفى (Floor) عشان يكملوا علاجهم وهما في أمان.
Overview:
This time, we are stepping into the most critical wing of Al-Noor Specialist Hospital: The Intensive Care Unit (ICU). This dashboard is a matter of life and death, literally. It helps hospital administration track patient outcomes, mortality rates, and operational efficiency within their most sensitive departments.
Key Data Insights:
The Core Vital Signs: The dashboard tracks 801 ICU stays across 645 patients. The ICU Mortality rate sits at 4.74%, and the Readmission rate (patients returning to the ICU) is 9.49%. These are the key performance indicators (KPIs) for evaluating critical care quality.
Identifying High-Risk Areas: When breaking down mortality by unit type, the Cardiac ICU stands out with the highest mortality rate (9.62%). This is a massive red flag (or at least an area of focus) for the administration to allocate more resources or highly specialized staff to this specific unit.
Length of Stay (LOS): The overall average time a patient spends in the ICU is quite short (2.79 days). However, patients in the Surgical ICU (SICU) require much longer recovery times, averaging around 11.6 days.
Demographics & Diagnoses: The data clearly shows that the elderly (patients > 89 years old) make up the largest demographic in the ICU. The leading cause of admission according to the APACHE diagnosis charts is Pulmonary Sepsis.
Patient Outcomes (The Good News): Looking at where patients go after the ICU, the vast majority (456 stays) are successfully discharged to a regular hospital "Floor". This indicates successful stabilization and a transition towards recovery.