Resturant analysis
تفاصيل العمل
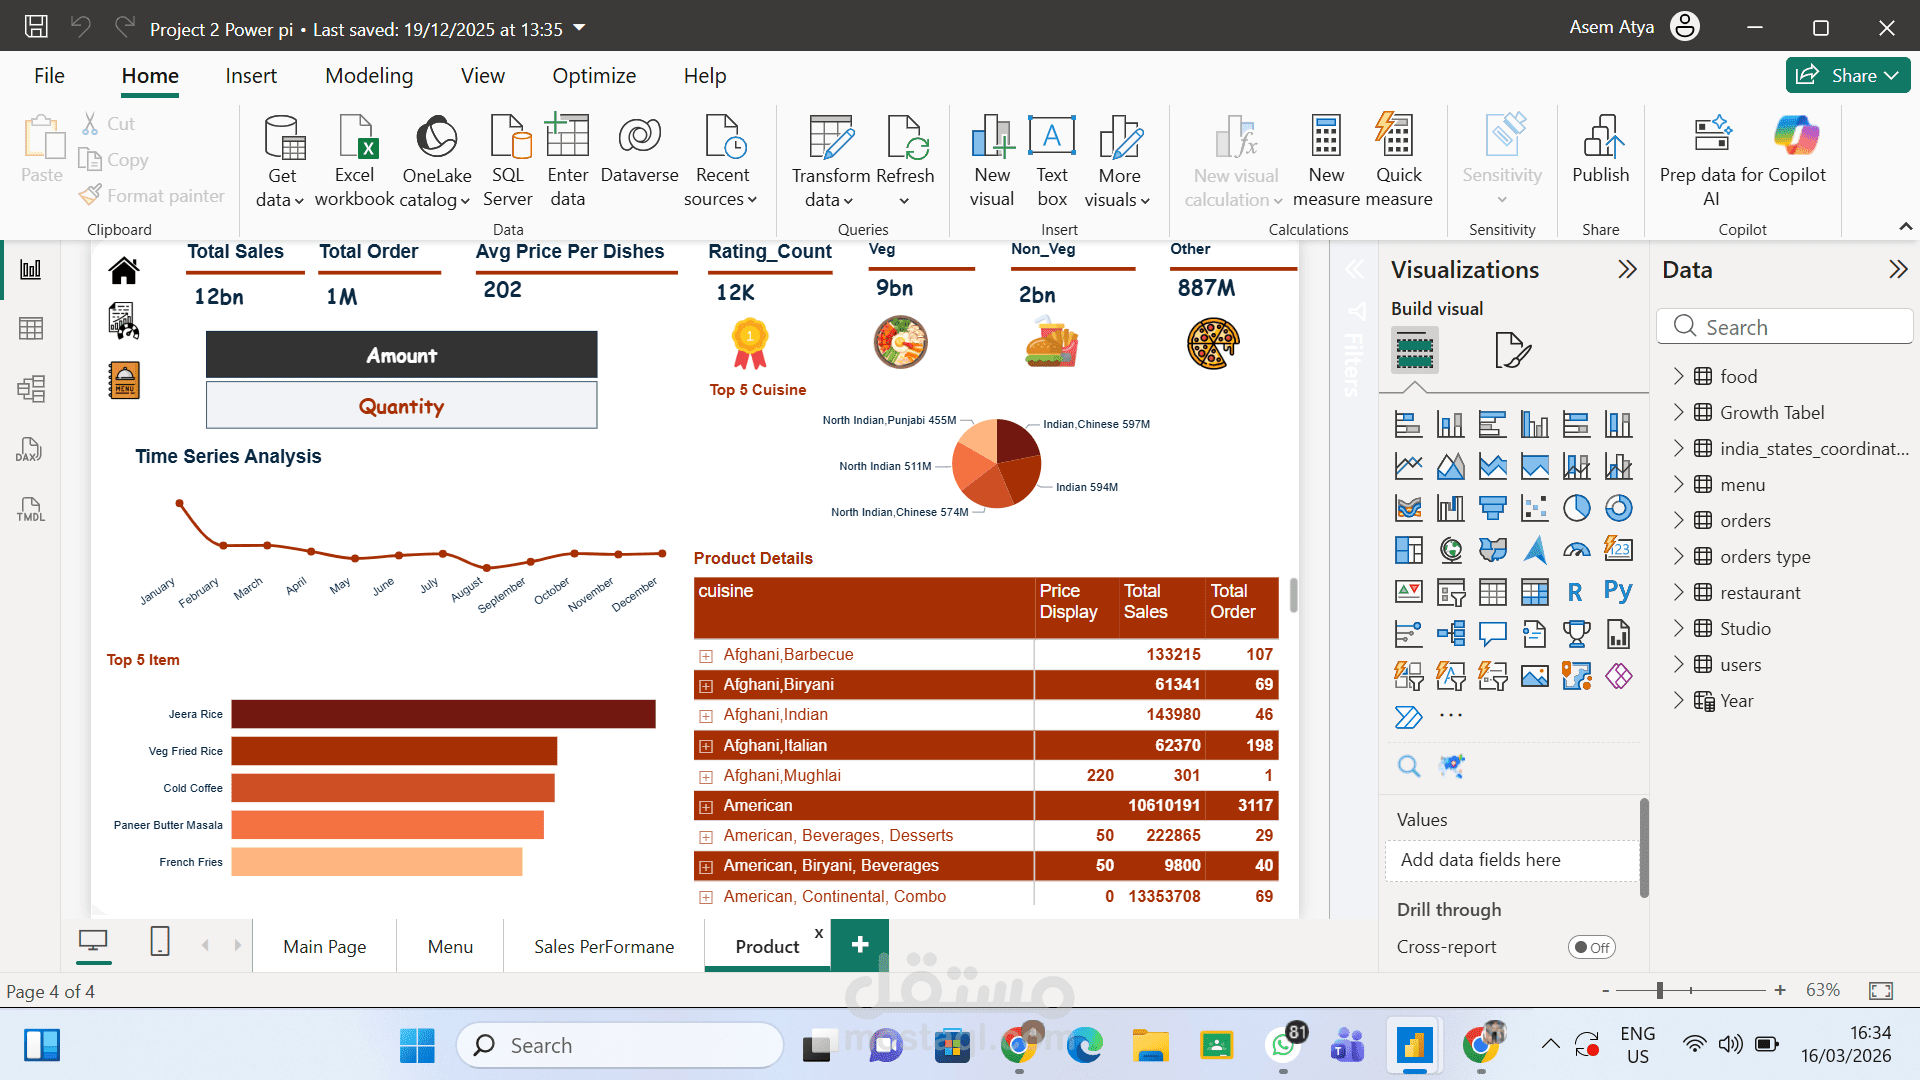
This project is a professional End-to-End Data Analysis for the Food & Beverage Industry, showcasing a strong visual identity and deep analytical insights using Power BI.
1. Product & Menu Analysis
Key Performance Indicators (KPIs): Tracks massive data scales, including 12bn in Total Sales, 1M Orders, and a significant breakdown of dietary preferences (9bn Veg vs. 2bn Non-Veg).
Item Performance: Uses a bar chart to highlight "Top 5 Items" (e.g., Jeera Rice, Veg Fried Rice) and a Donut Chart for Cuisine Distribution, showing the popularity of North Indian and Chinese dishes.
Granular Details: Features a detailed "Product Details" table that breaks down sales and orders by specific cuisine sub-types (e.g., Afghani Barbecue, American Beverages).
2. Sales Performance & Growth
Growth Tracking: A dedicated growth table compares Year-over-Year (YoY) performance, showing a massive 52.73% growth rate in 2020.
Geographic & User Insights: Identifies the Top 5 Cities (led by Ahmedabad) and the Top 5 Users, helping businesses target their most loyal customers and high-performing regions.
Time Series Analysis: A line chart visualizes sales trends over time, enabling stakeholders to identify seasonal peaks and long-term market patterns.