E-commerce analysis
تفاصيل العمل
1. Navigation & Control (Main Page)
Purpose: Acts as a central hub for the report.
Feature: Includes an intuitive sidebar with Slicers for filtering by Year and Month, and interactive buttons for seamless navigation between specific dashboards.
2. Sales Overview (Sales Dashboard)
KPIs: Tracks high-level metrics like Total Sales ($256.52M), Total Profit ($153.91M), and AOV ($9.16K).
Visuals: Features a monthly sales trend line and a Treemap to identify top-performing categories like Toys, Games, and Pet Supplies.
3. Customer Insights
Loyalty: Highlights a high Repeat Customer Rate (83.15%), indicating strong brand retention.
Segmentation: Categorizes customers into groups (High, Moderate, New) based on their spending behavior and order frequency.
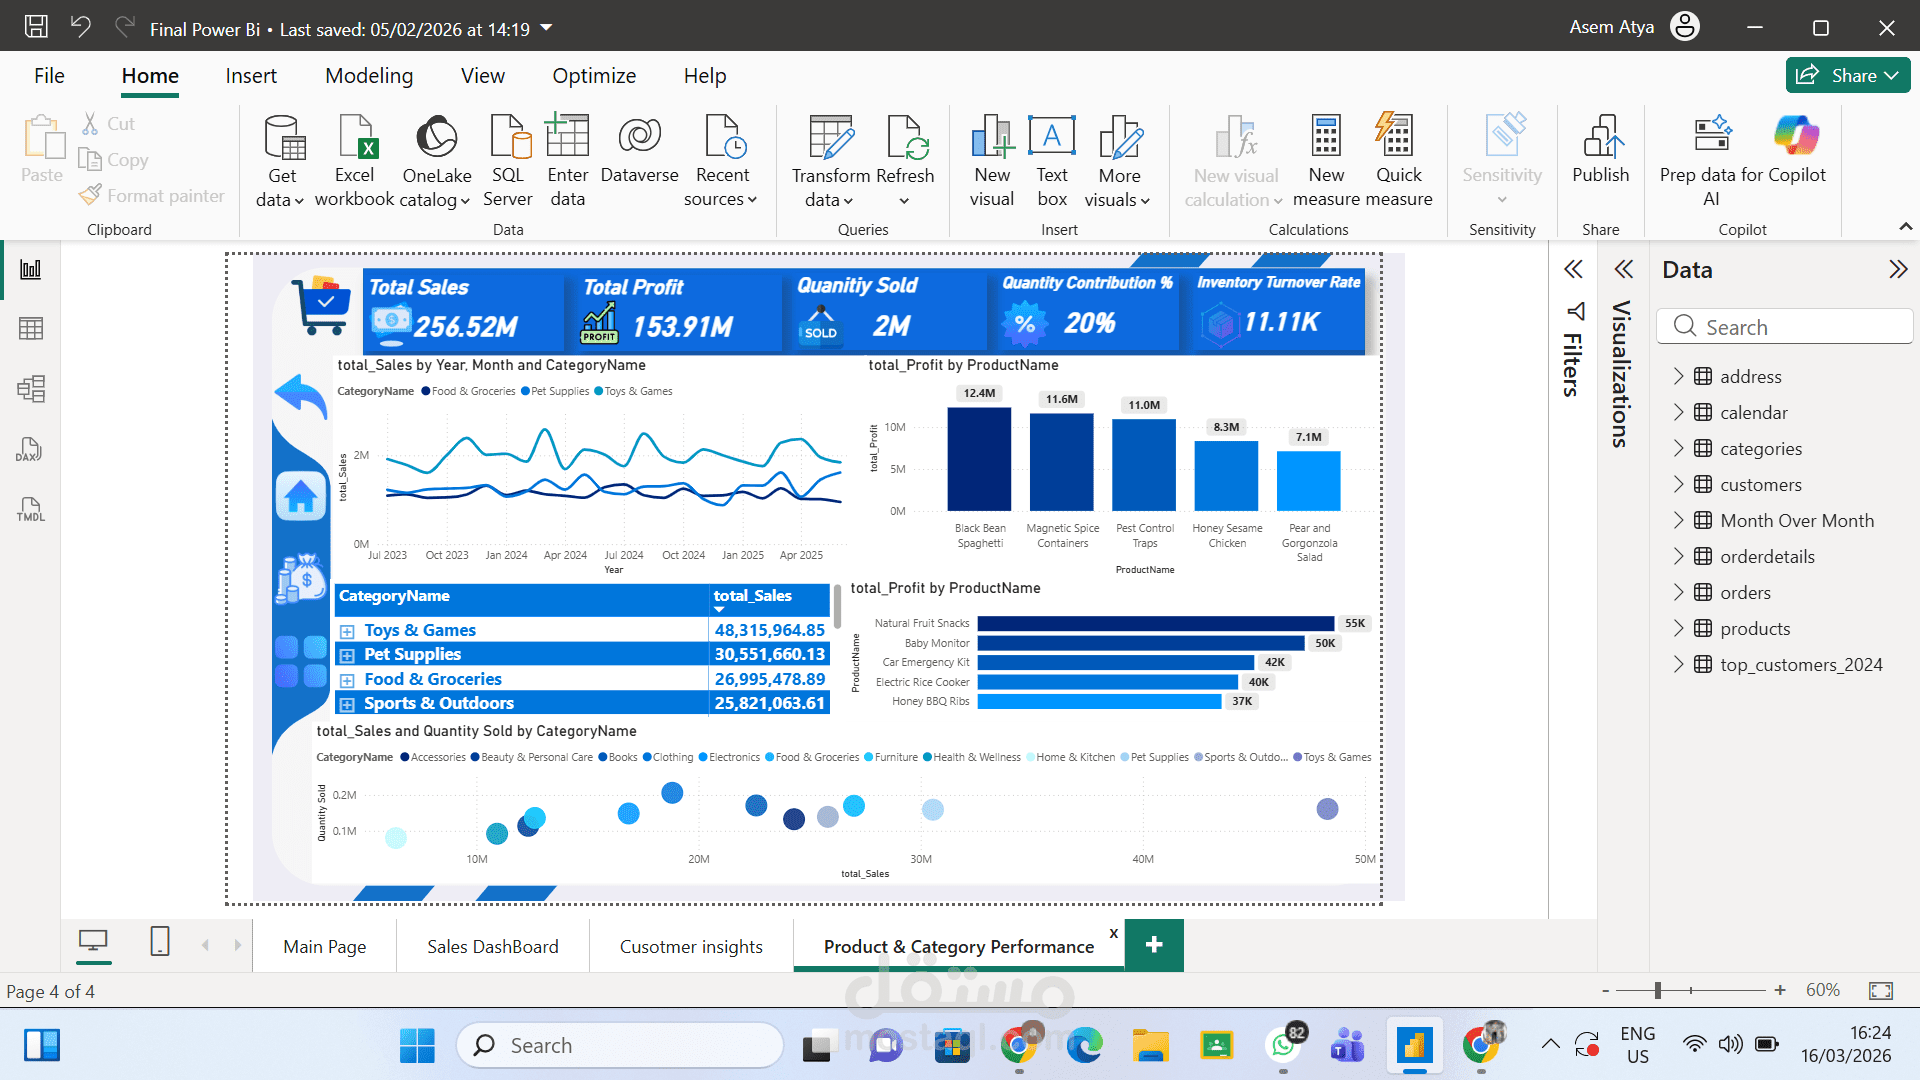
4. Product & Category Performance
Inventory Efficiency: Tracks the Inventory Turnover Rate, which is crucial for supply chain health.
Advanced Mapping: Uses a Scatter Chart to correlate sales volume with quantity sold, helping identify high-margin vs. high-volume products.