Product Sales Dashboard (Excel)
تفاصيل العمل
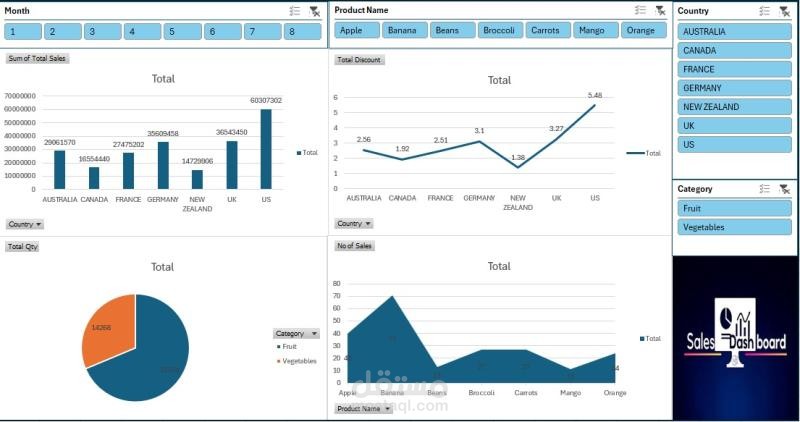

Developed an interactive Excel dashboard to analyze product sales across countries, categories, and sales representatives.
Used pivot tables, charts, slicers, and conditional formatting to visualize total sales, quantity, discount impact, and product performance.
Enabled dynamic filtering by country, category, and date for business insights.