Patient Behavior Analysis Dashboard – Healthcare Data Analytics Project
تفاصيل العمل
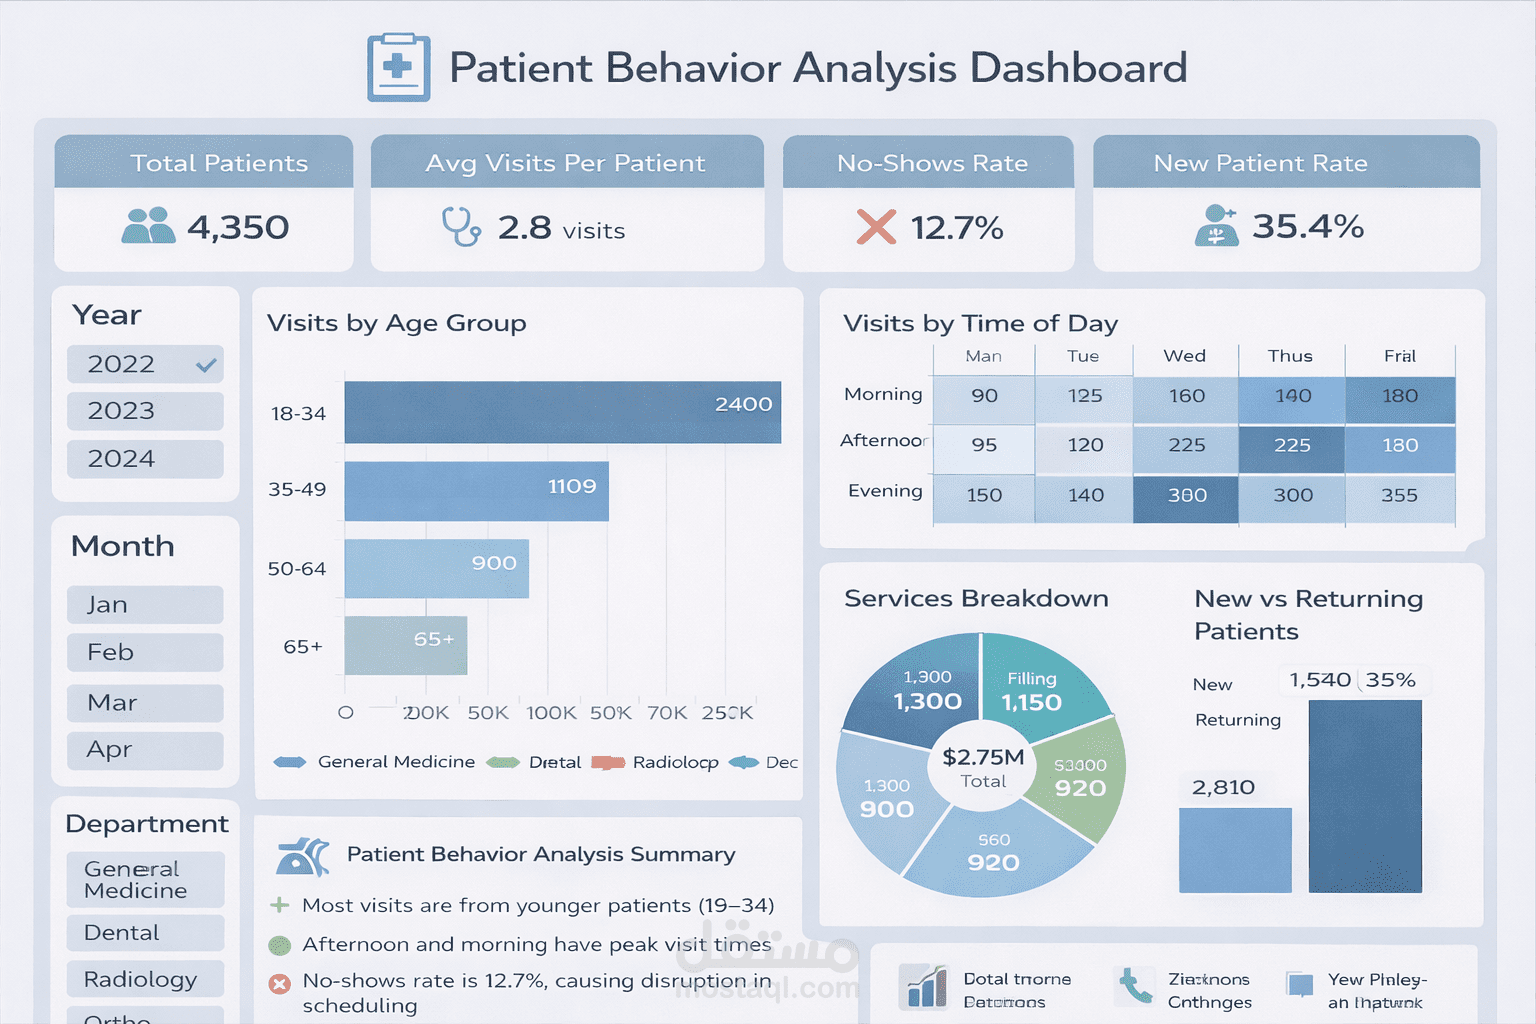
? **Patient Behavior Analysis Dashboard – Healthcare Data Analytics Project**
Understanding patient behavior is essential for improving healthcare services and clinic operations.
In this project, I built an interactive dashboard using **Microsoft Excel** to analyze patient visit patterns, demographics, and appointment behavior.
The objective was to use data analysis to answer important operational questions and support better decision-making in healthcare settings.
? **Key Questions Explored**
• Which patient age groups visit the clinic most frequently?
• What are the peak hours for patient visits?
• What is the rate of missed appointments (No-Shows)?
• How many patients are new versus returning?
• Which services are most frequently performed?
? **Key Dashboard Metrics**
• Total Patients
• Average Visits per Patient
• No-Show Rate
• New Patient Rate
• Patient Distribution by Age Group
? **Tools & Techniques Used**
• Pivot Tables
• Interactive Dashboard Design
• Data Visualization
• KPI Performance Tracking
? **Key Insights**
The analysis showed that the majority of visits come from younger patient groups and that certain time periods during the day experience higher patient traffic.
Additionally, the dashboard highlights the impact of missed appointments on clinic efficiency.
? **Project Goal**
To demonstrate how patient data can be transformed into meaningful insights that help healthcare providers improve scheduling, patient engagement, and service planning.
#DataAnalytics #HealthcareAnalytics #Excel #PatientAnalytics #DataVisualization