Healthcare Revenue Analysis Dashboard – Data Driven Decision Making
تفاصيل العمل
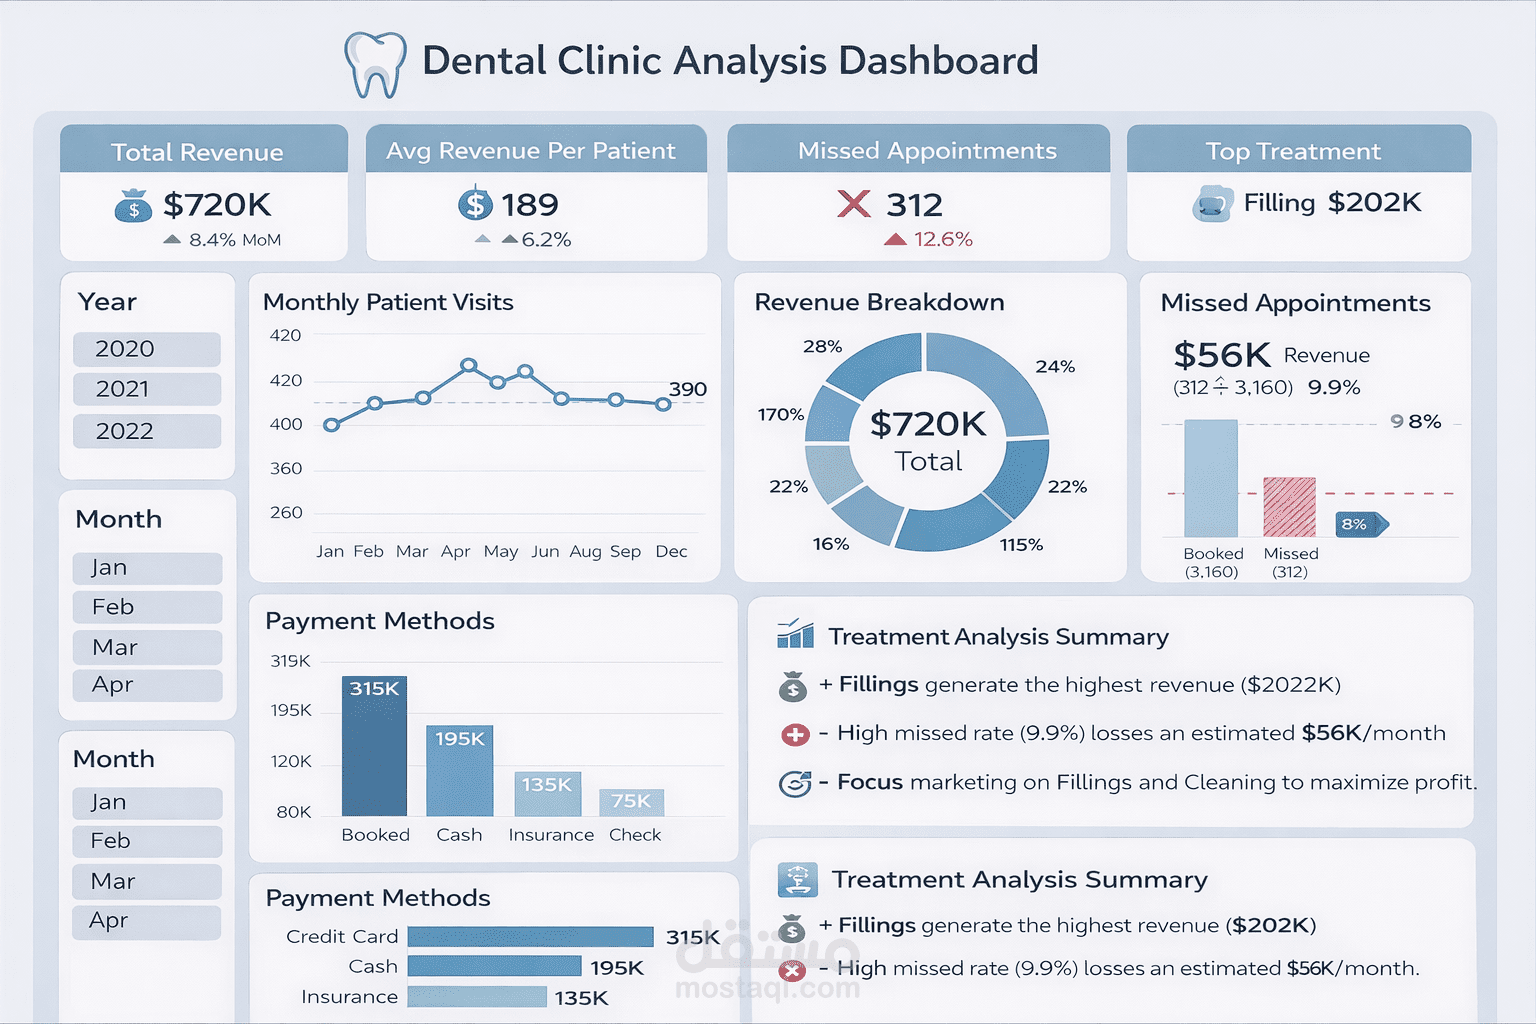
? **Healthcare Revenue Analysis Dashboard – Data Driven Decision Making**
As part of my journey into healthcare data analytics, I developed this interactive dashboard using **Microsoft Excel** to analyze revenue performance across multiple healthcare departments.
The goal of this project was to apply a **problem-solving approach** to understand how different services contribute to overall revenue and identify opportunities for better operational decisions.
? **Key Business Questions Addressed**
• Which healthcare departments generate the highest revenue?
• How does revenue change over time across different services?
• What is the average revenue generated per patient?
• Which departments contribute the most to clinic profitability?
? **Key Dashboard Metrics**
• Total Revenue
• Total Profit
• Average Revenue per Patient
• Services Performed
• Profit Margin by Department
? **Tools & Techniques Used**
• Pivot Tables
• Data Visualization
• Interactive Dashboard Design
• KPI Performance Tracking
? **Key Insight**
The analysis revealed that a small number of healthcare services contribute to the majority of total revenue.
This insight can help management focus on high-value services and allocate resources more efficiently.
? **Project Goal**
To demonstrate how **data analysis and visualization can support strategic decision-making in healthcare organizations.**
#DataAnalytics #Excel #HealthcareAnalytics #DataVisualization #ProblemSolving