Dashboard By Power BI
تفاصيل العمل
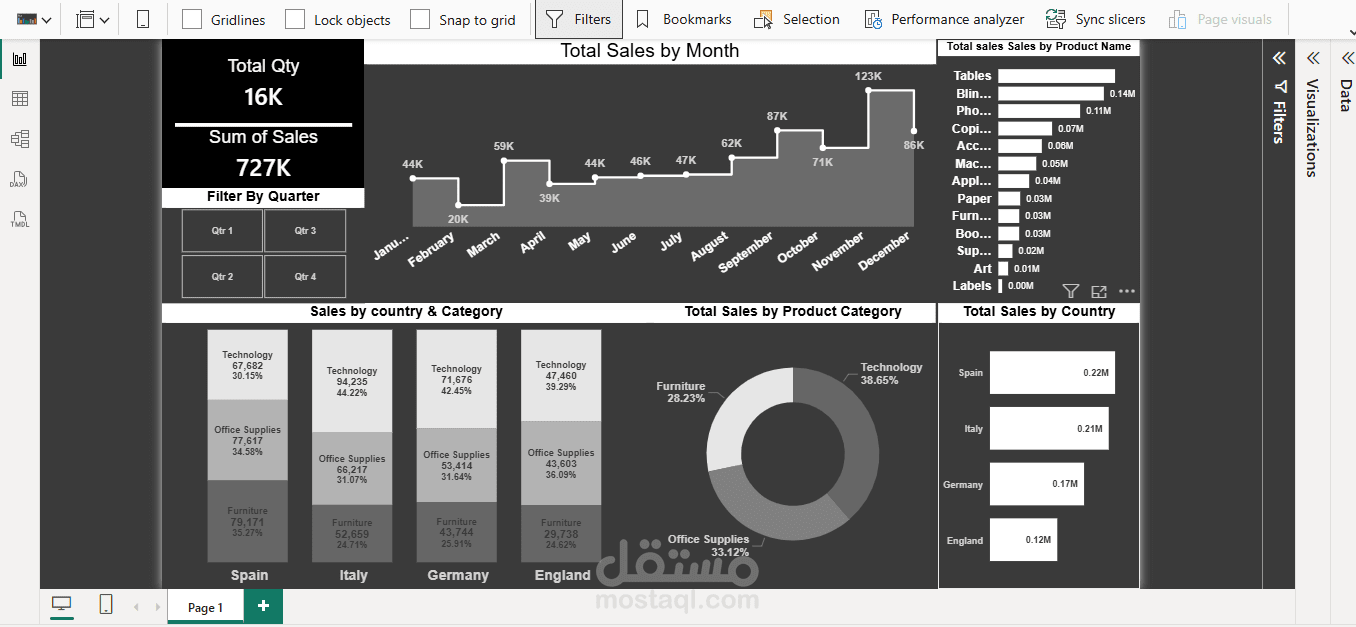
In this project, I analyzed sales data and created an interactive dashboard showing:
* Total Sales & Quantity
* Monthly Sales Trends according Qtr Slicer
* Sales by Product Category
* Top Products Performance
* Sales by Country
Data visualization helps turn raw data into clear insights that support better decisions.