Insurance Risk Analysis Dashboard | Power BI
تفاصيل العمل
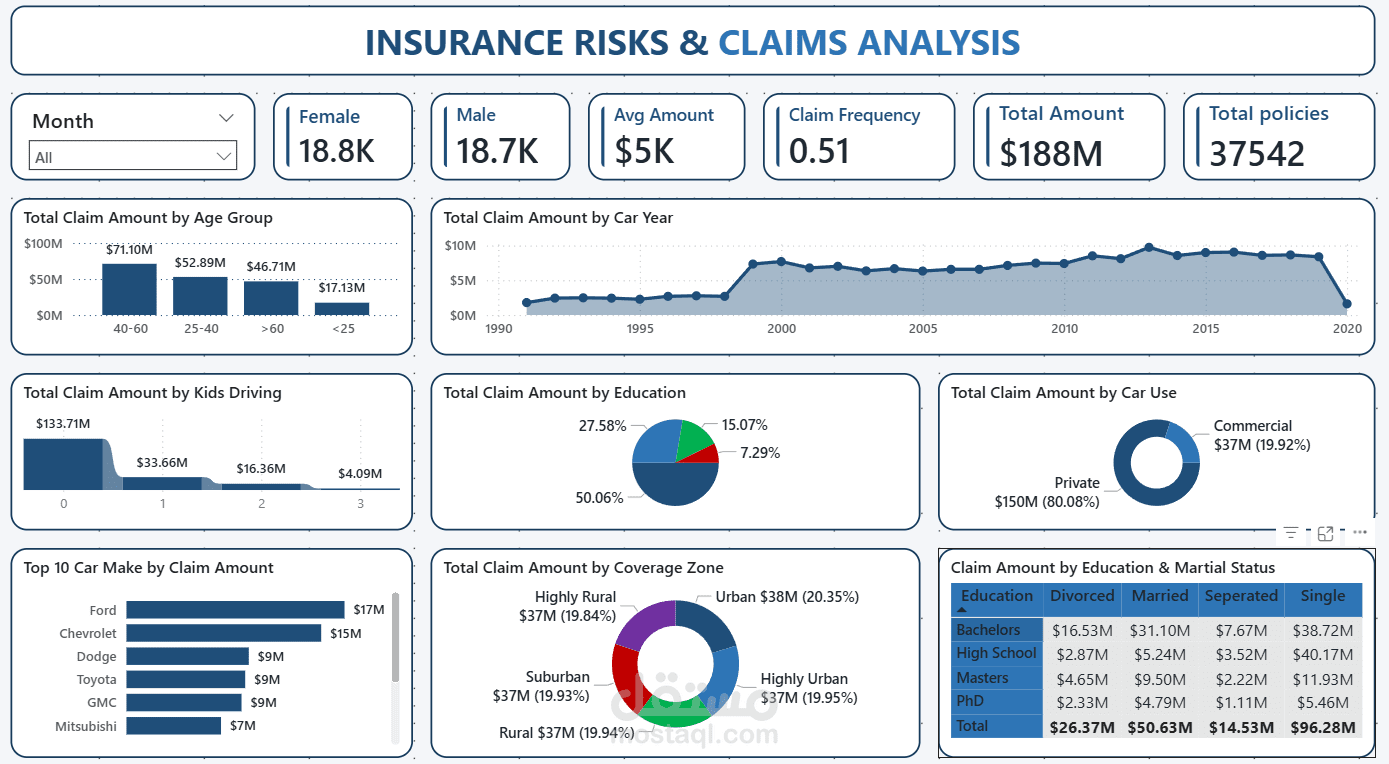
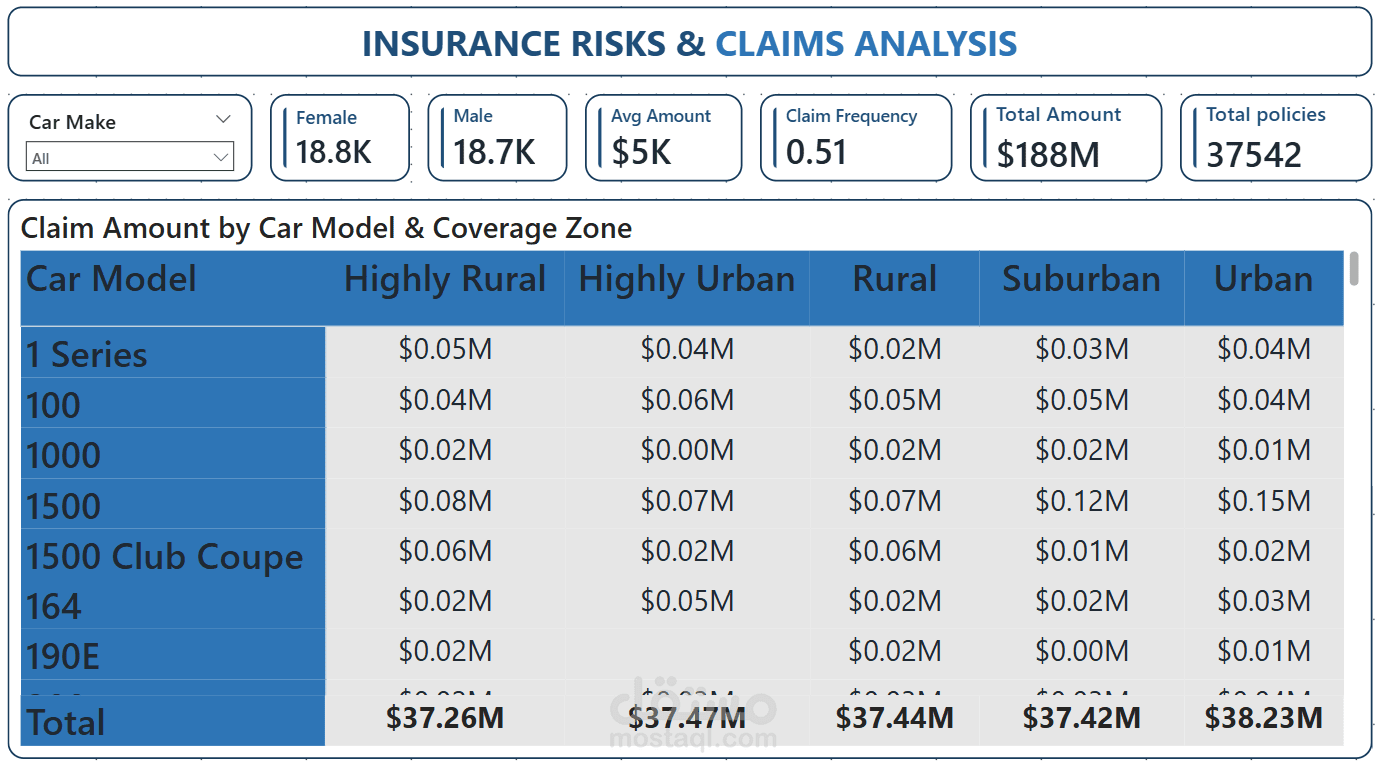
I built an interactive Insurance Risk Analysis dashboard to explore claim behavior and uncover key risk patterns that can support underwriting and pricing decisions.
-- Key KPIs
• Total Policies
• Total Claim Amount
• Average Claim Amount
• Claim Frequency
• Total Male vs Female Policyholders
-- Key Insights
• Claim Amount by Age Group – Identified high-risk age segments.
• Claim Amount by Car Year – Analyzed how vehicle age impacts claim cost.
• Claim Amount by Education Level – Observed behavioral differences across segments.
• Claim Amount by Coverage Zone – Compared regional risk exposure.
• Claim Amount by Car Use – Personal vs Commercial impact on claims.
• Claim Amount by Car Make – Detected higher-cost brands.
• Claim Amount by Number of Kids Driving – Evaluated household risk factor.
Detailed Analysis
• Claim Amount by Education & Marital Status