Restaurant Sales Analysis Dashboard
تفاصيل العمل
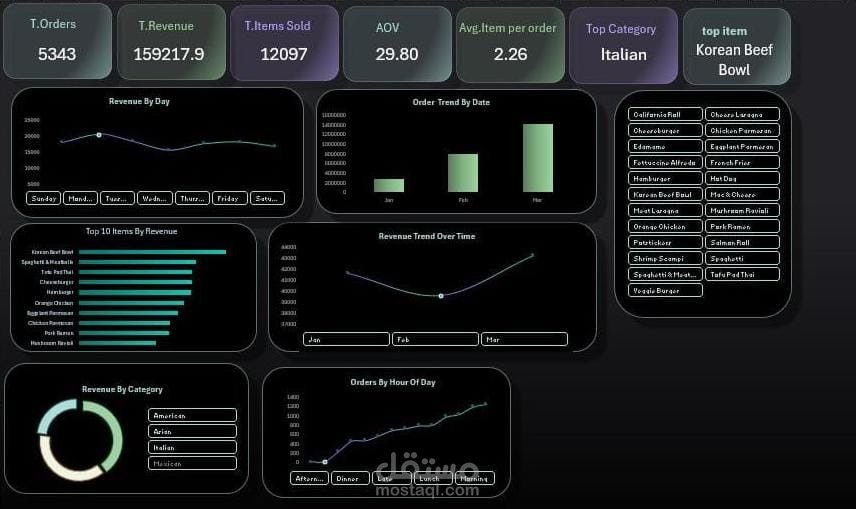
This dashboard analyzes restaurant sales data to understand customer behavior, product performance, and revenue trends.
I transformed raw data into meaningful insights through data analysis and visualization techniques.
The dashboard highlights several important metrics including:
Total Orders
Total Revenue
Items Sold
Average Order Value (AOV)
Average Items per Order
Top Selling Category and Item
It also includes visual analysis of:
Revenue trends over time
Order trends by date
Top 10 items by revenue
Revenue distribution by category
Orders by time of day
This interactive dashboard helps businesses quickly understand sales performance and identify opportunities for improvement.
Tools Used:
Microsoft Excel
Data Analysis
Pivot Tables
Dashboard Development