Sales Performance Dashboard – Data Analysis
تفاصيل العمل
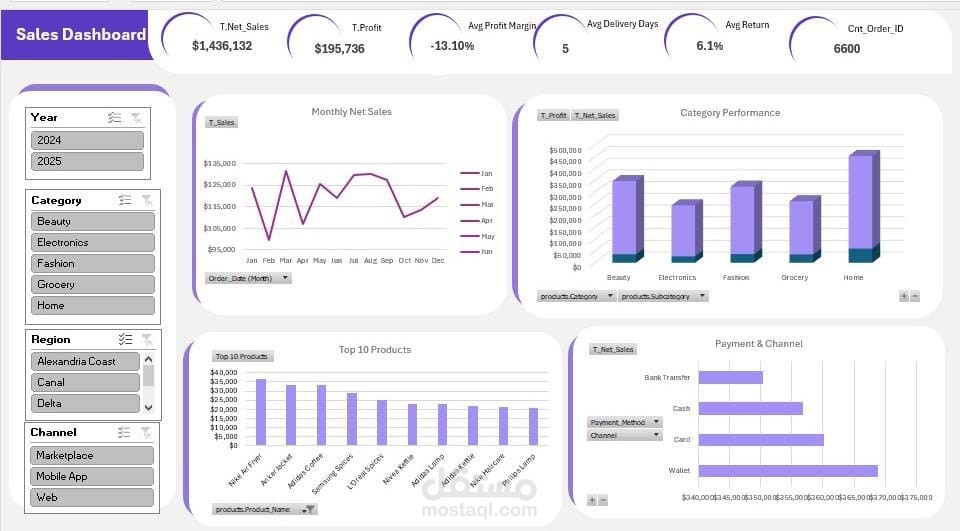
This project focuses on analyzing sales performance across different regions, categories, and sales channels.
I worked on cleaning and organizing the dataset, then used Excel tools to analyze sales trends and identify key performance indicators.
The dashboard provides interactive insights including:
Total Net Sales and Profit
Profit Margin Analysis
Monthly Sales Trends
Top 10 Products by Sales
Category Performance Comparison
Sales Distribution by Payment Method
Interactive filters such as Year, Category, Region, and Channel allow users to explore the data dynamically and quickly identify business insights.
Tools Used:
Microsoft Excel
Pivot Tables
Data Visualization
Dashboard Design