Airport Traffic analysis
تفاصيل العمل
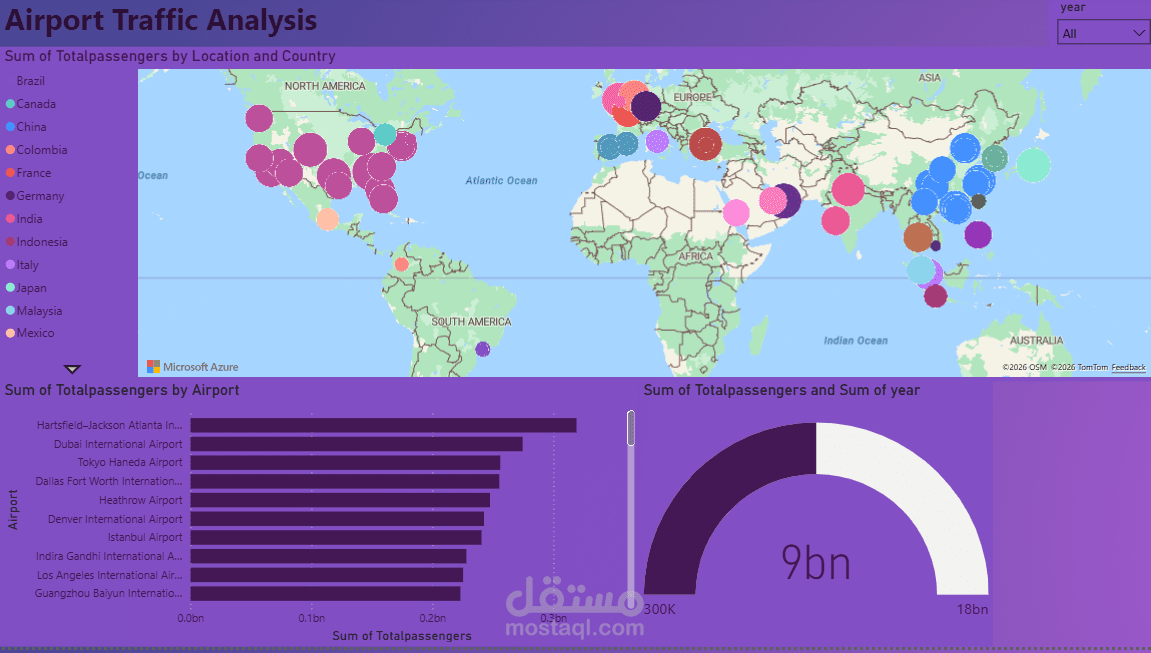
Key Insights Delivered:
Identification of the highest passenger traffic airports globally.
Comparison of passenger volumes across multiple regions.
Visualization of global airport traffic distribution on an interactive map.
Aggregated KPI metrics showing overall passenger traffic.
Tools & Technologies Used:
Microsoft Power BI – Data visualization and dashboard creation
Microsoft Excel – Data cleaning and preparation
Data modeling and KPI visualization techniques