excel data analysis
تفاصيل العمل
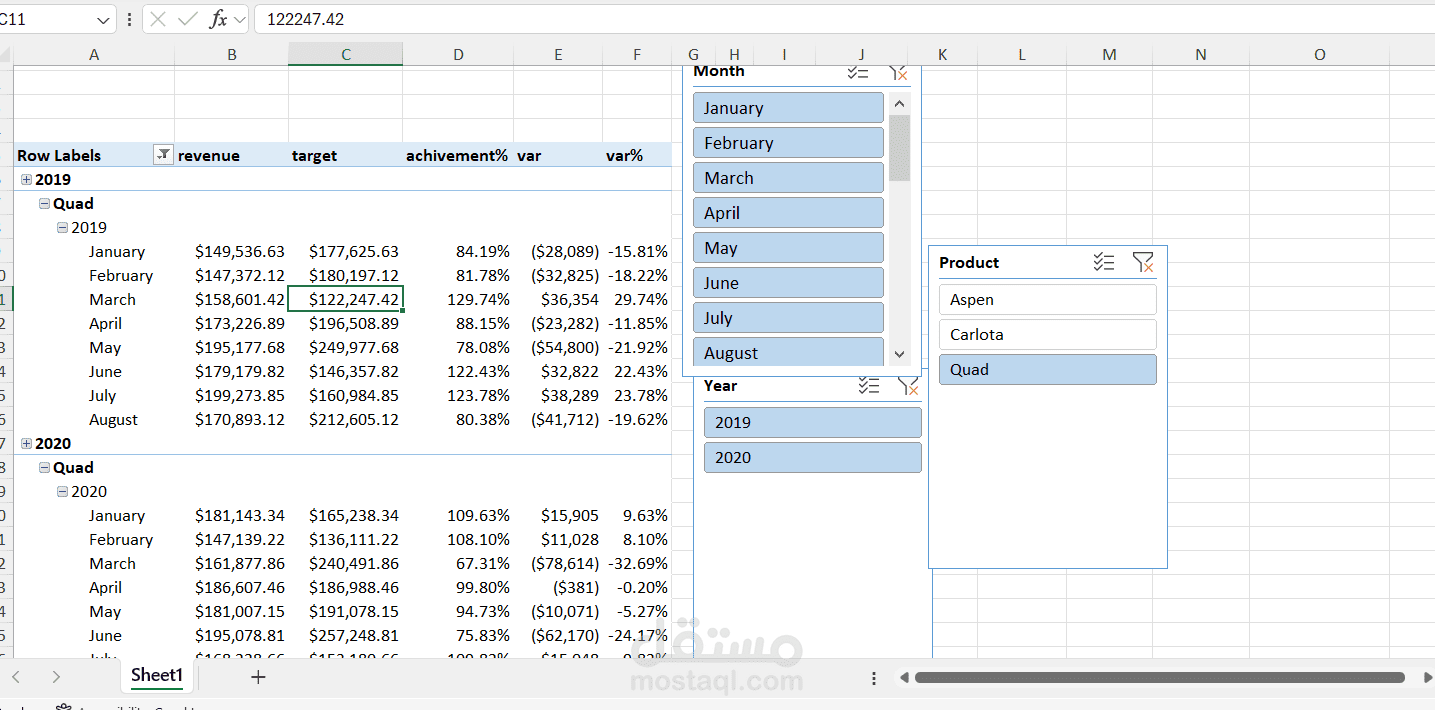
Revenue and Budget Analysis Report (Excel)
This report provides a detailed analysis of revenue and budget performance using Microsoft Excel. It helps track financial performance by comparing actual revenue with planned budgets and identifying variances that may impact business decisions.
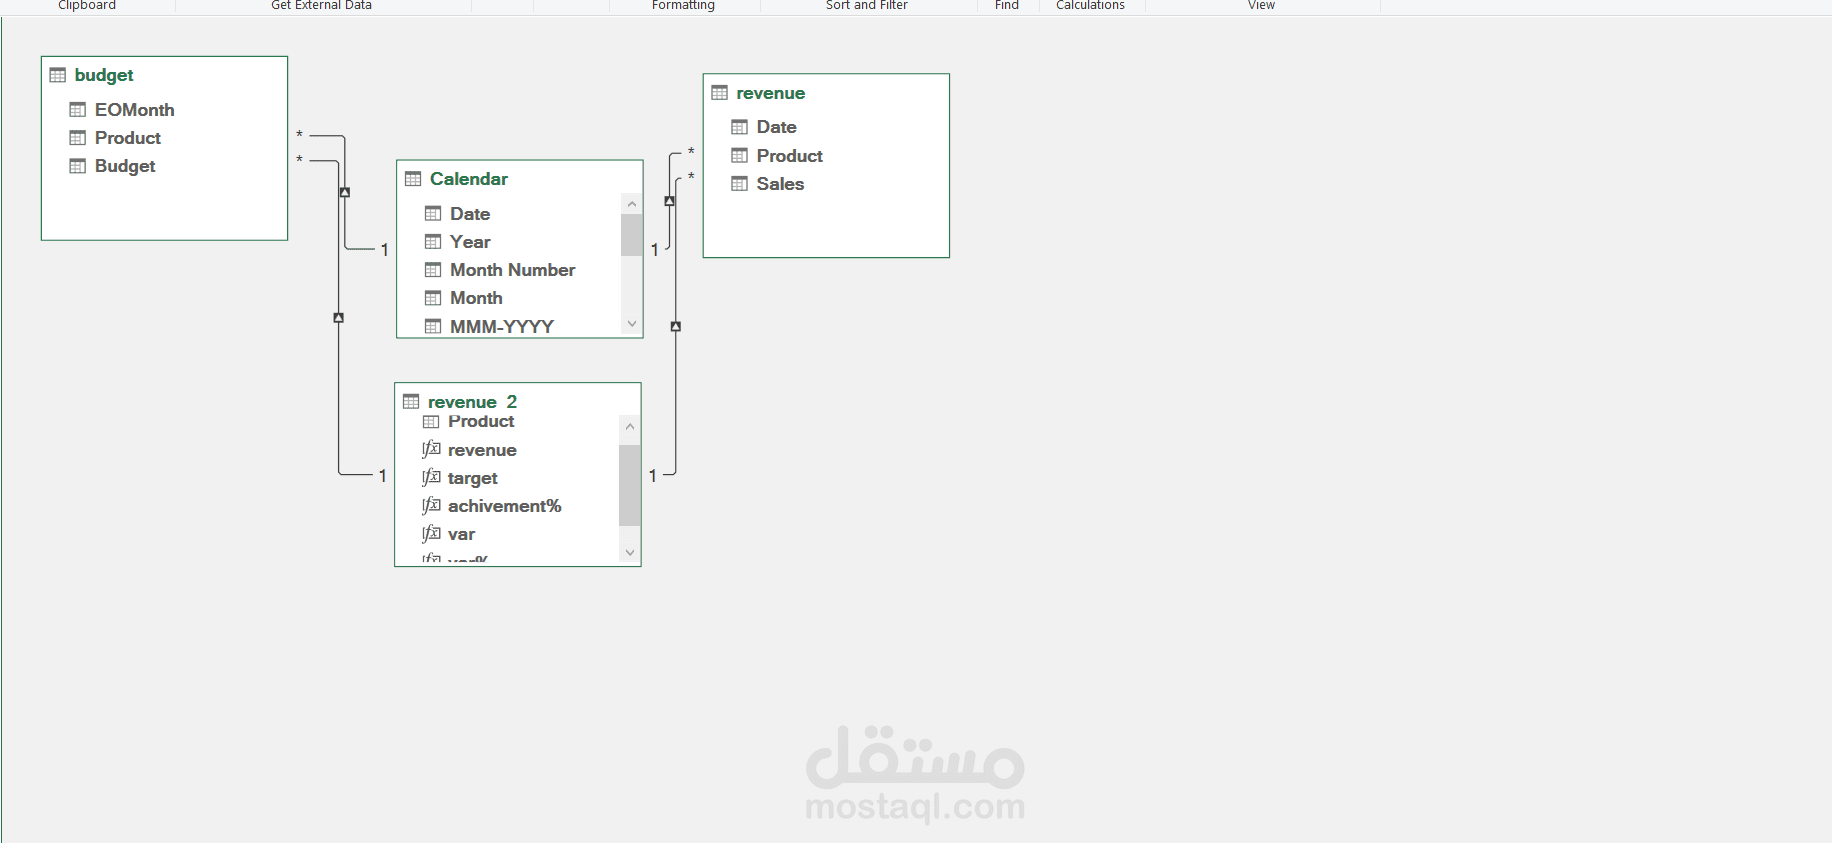
The report includes clear visualizations and organized tables to monitor financial trends, evaluate whether revenue targets are being met, and highlight areas where spending or earnings differ from the planned budget. Using Excel tools such as Pivot Tables, charts, and formulas, the report transforms raw financial data into meaningful insights that support better financial planning and decision-making.
Key Features
Total Revenue Overview
Budget vs Actual Revenue Comparison
Variance Analysis
Trend Analysis using charts
Organized financial data for easy interpretation
This type of financial reporting helps organizations monitor performance, control budgets, and make data-driven financial decisions