تحليل بيانات dashboard
تفاصيل العمل
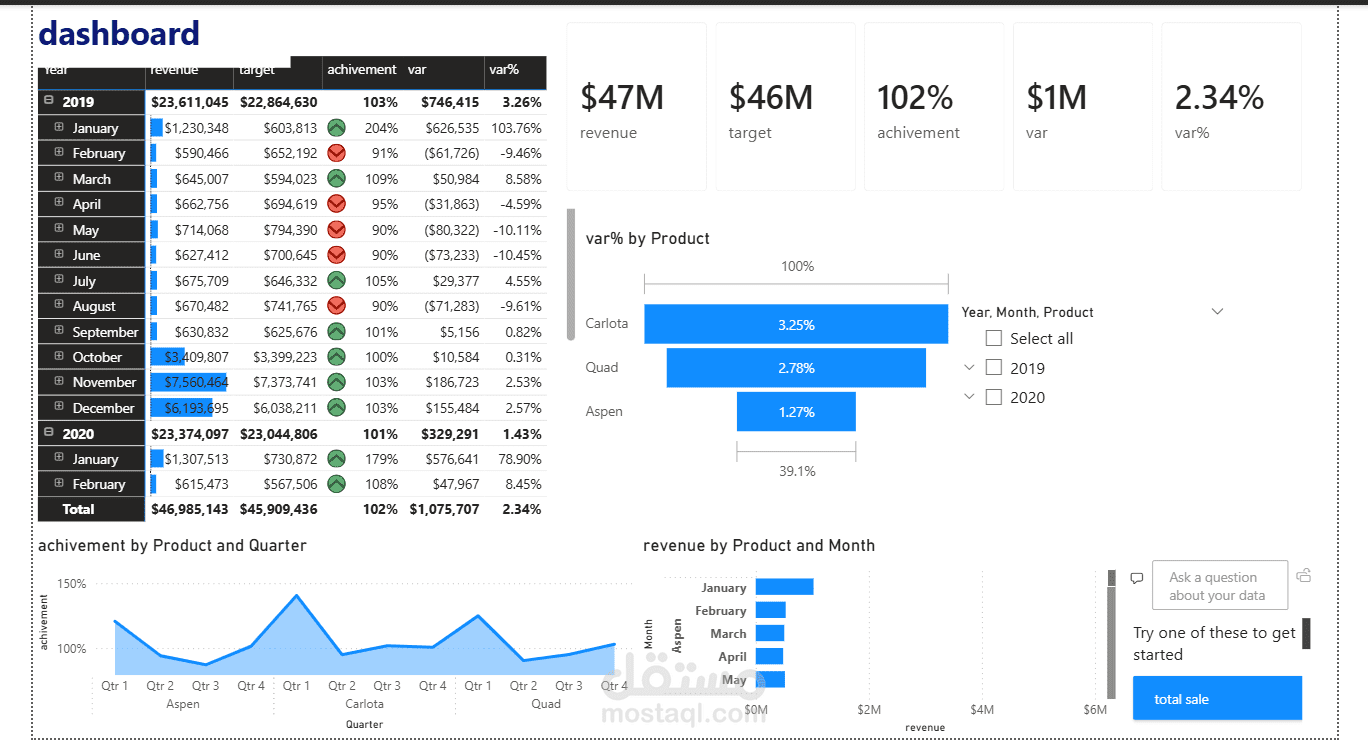
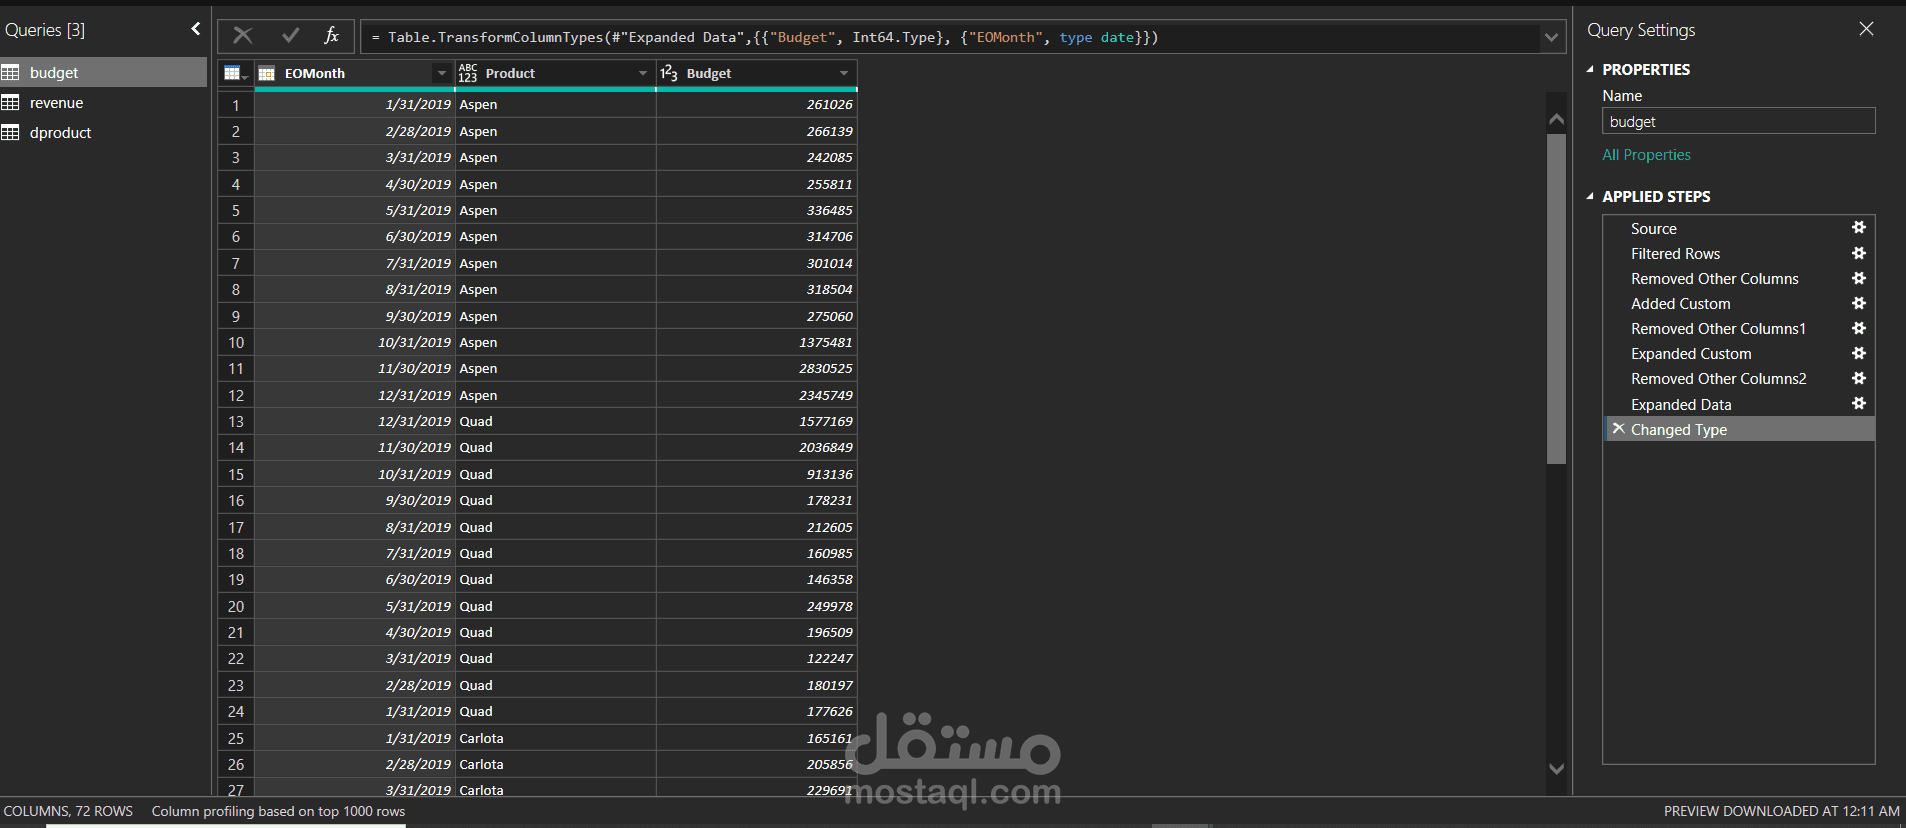
This dashboard provides a comprehensive analysis of product revenue and performance. It helps identify the most profitable products, track revenue trends, and support data-driven decision-making.
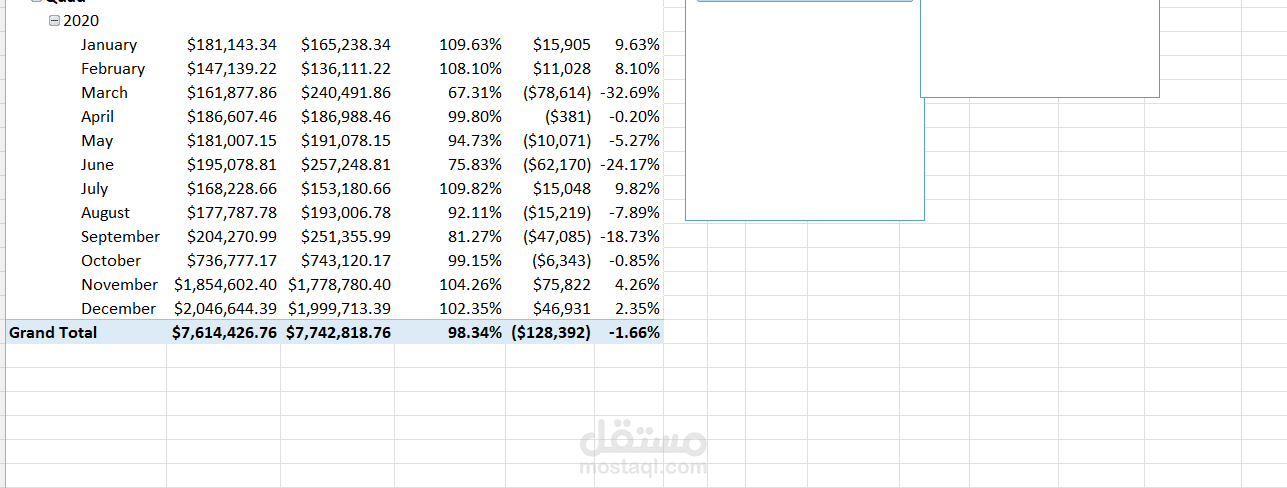
The dashboard includes key metrics such as total revenue, revenue by product category, and product performance comparisons. Interactive visuals allow users to explore sales patterns, identify top-performing products, and detect underperforming ones.
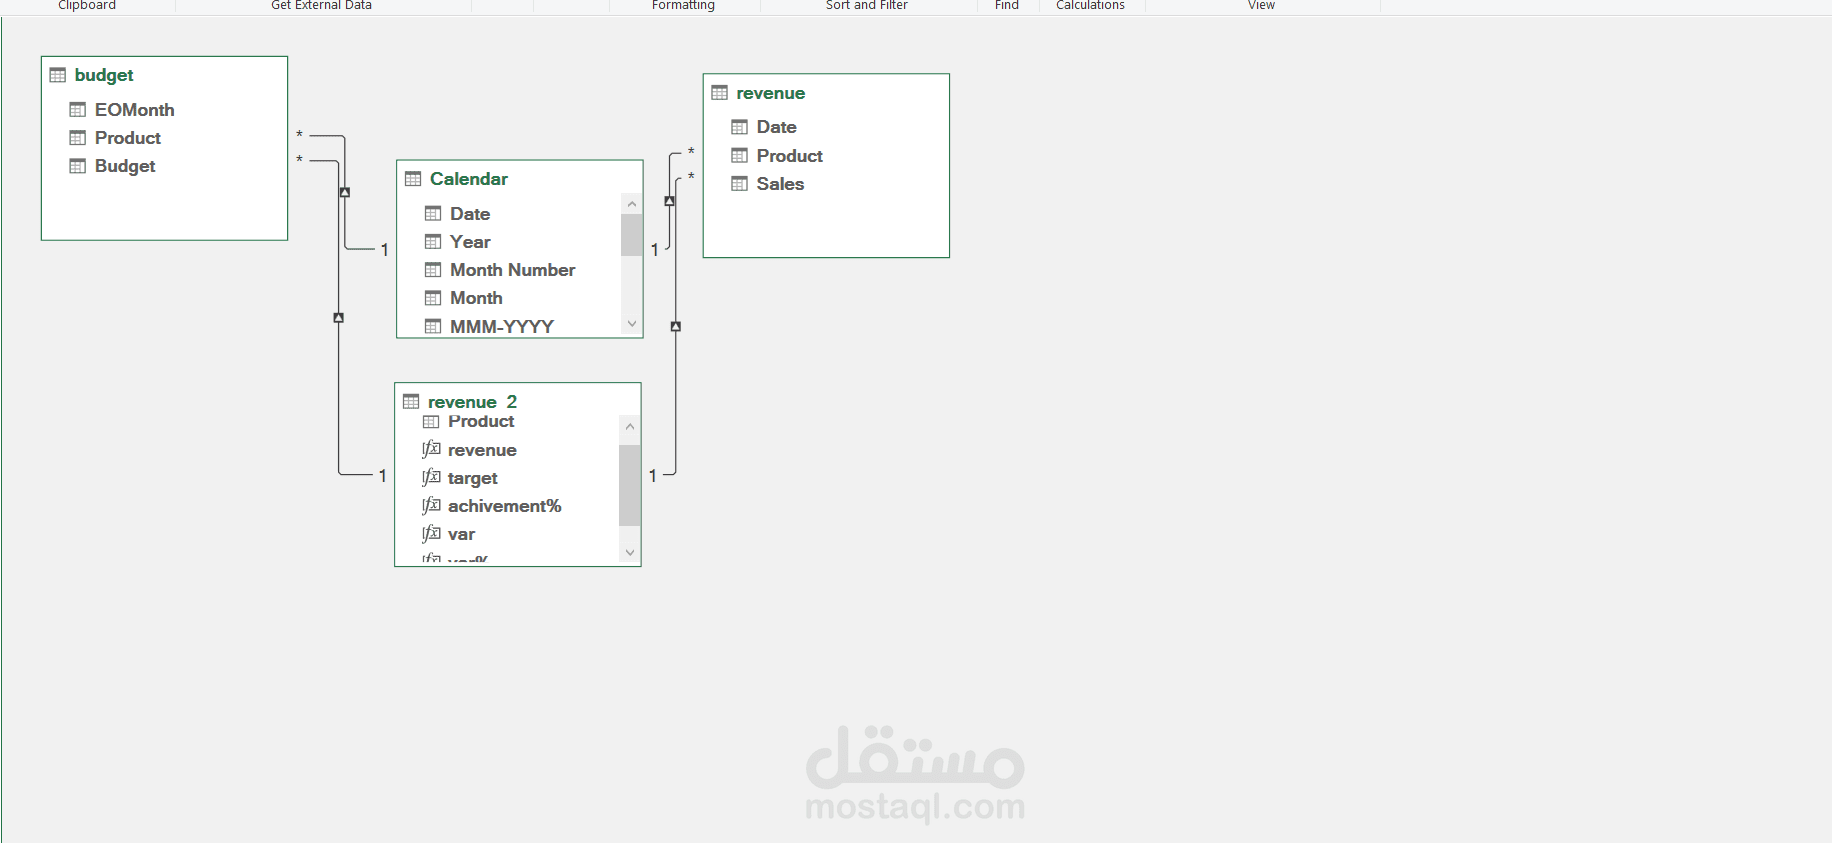
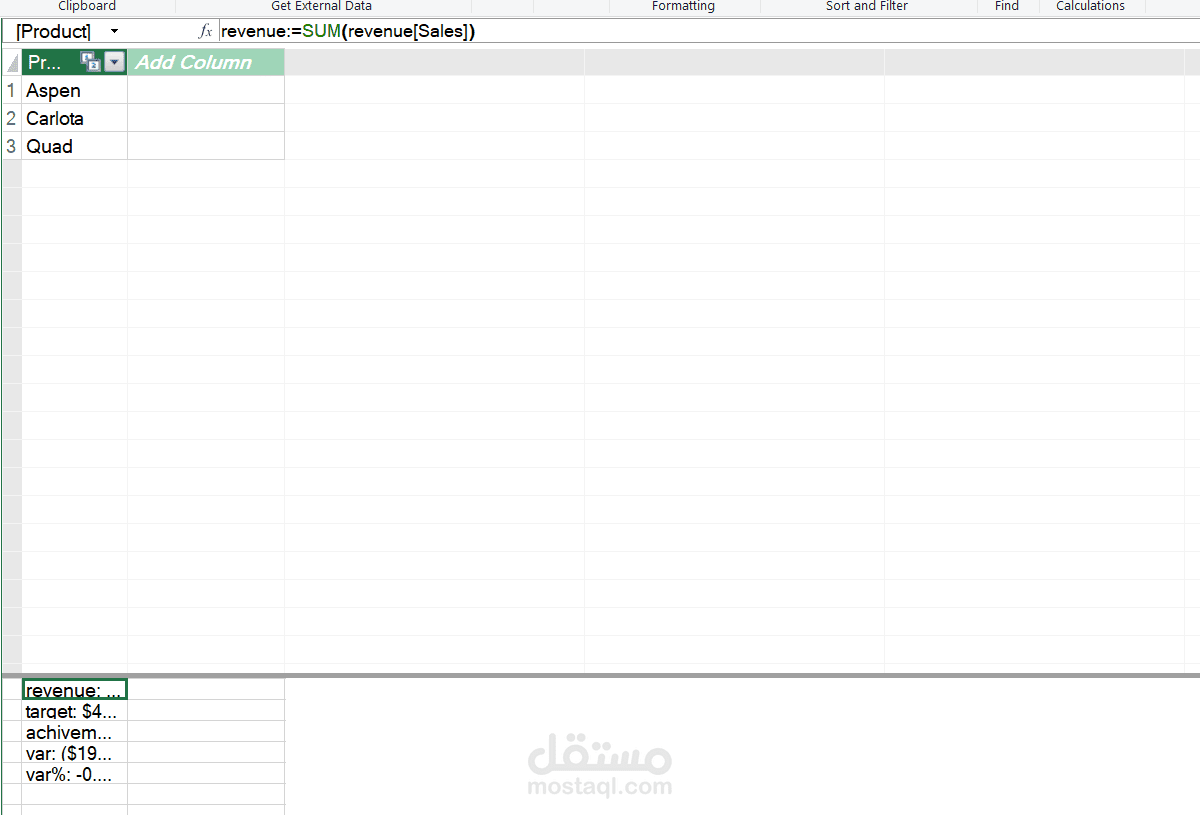
Using tools like Power BI / Excel, the dashboard transforms raw sales data into clear and actionable insights, enabling businesses to optimize product strategies and improve overall revenue performance.