Global Sales Performance Dashboard
تفاصيل العمل

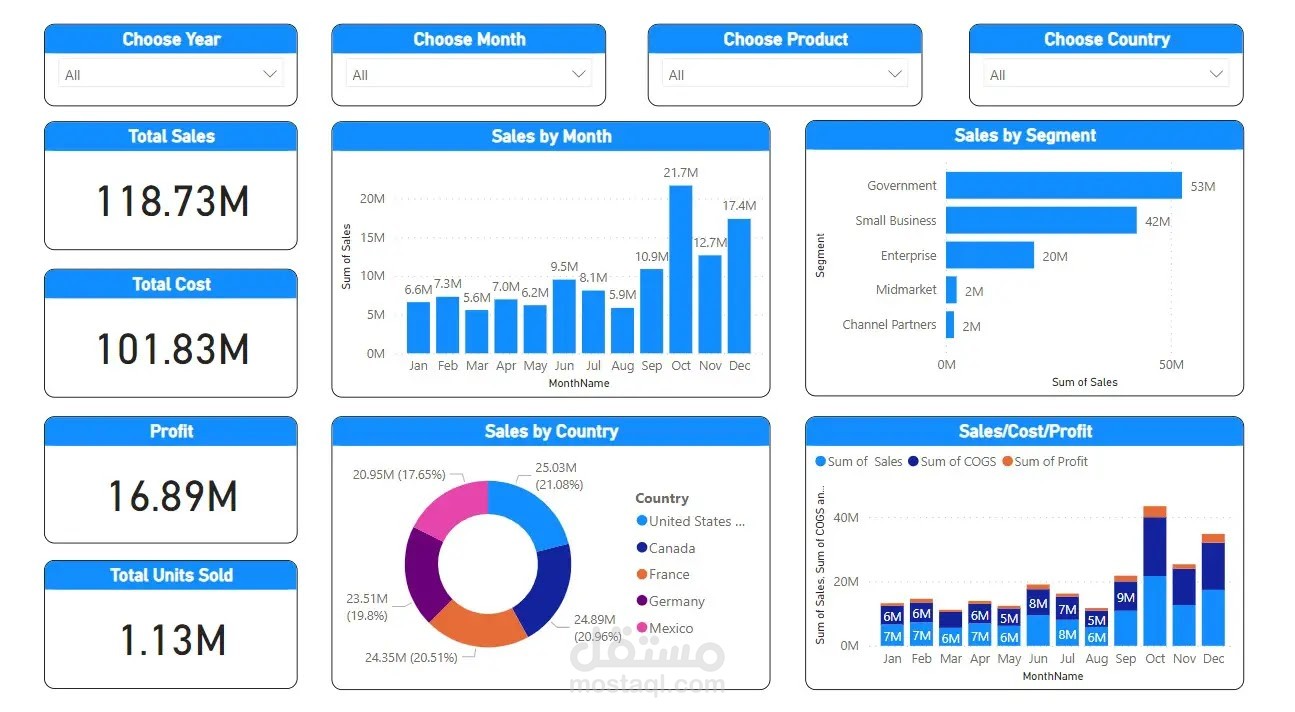
evaluate overall business growth.
It presents key KPIs such as Total Sales, Total Cost, Profit, and Total Units Sold. The dashboard also visualizes sales trends by month, sales distribution by country, and performance by business segment.
Interactive filters allow users to explore sales data by year, month, product, and country for deeper analysis.
Key Insights
Government and Small Business segments contribute the highest revenue.
Sales show strong growth toward the end of the year.
Multiple countries contribute to overall revenue, with balanced distribution.
Tools Used
Power BI • Data Visualization • Business Intelligence