Bank Performance Dashboard
تفاصيل العمل
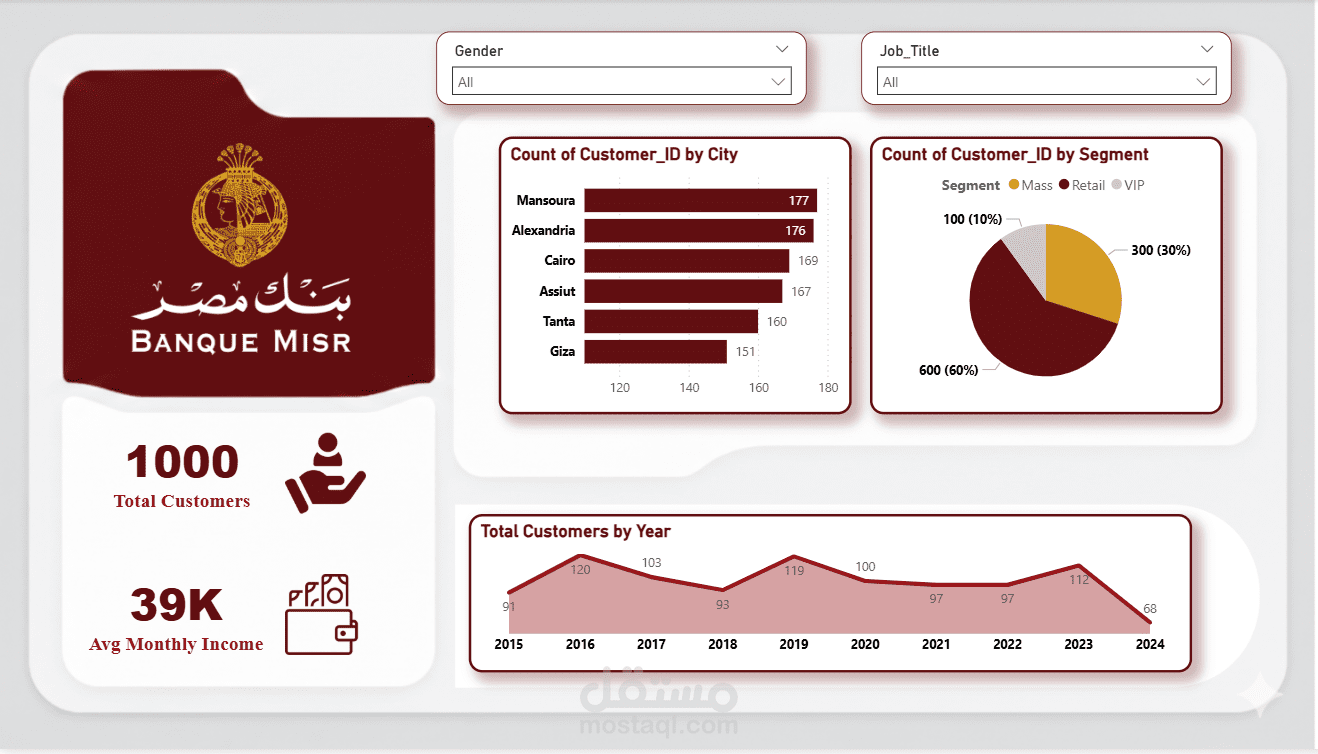
Advanced Banking Data Analytics & Visualization Dashboard
Project Overview:
I developed a comprehensive, interactive Power BI dashboard focused on banking sector data (Case Study: Banque Misr). The goal was to transform raw financial data into actionable insights through intuitive visualizations.
Key Deliverables:
Data Transformation: Leveraged Power Query to clean and shape complex financial datasets.
In-depth Analysis: Developed custom DAX measures to track Key Performance Indicators (KPIs) such as customer churn, loan distribution, and regional performance.
Interactive Visuals: Built a user-friendly interface with drill-down capabilities, allowing stakeholders to view data at both macro and micro levels.
Optimized Data Model: Created a scalable Star Schema model for seamless report performance.
Tools Used: Power BI Desktop, DAX, Power Query, Data Modeling