Retail Sales Analysis Dashboard
تفاصيل العمل
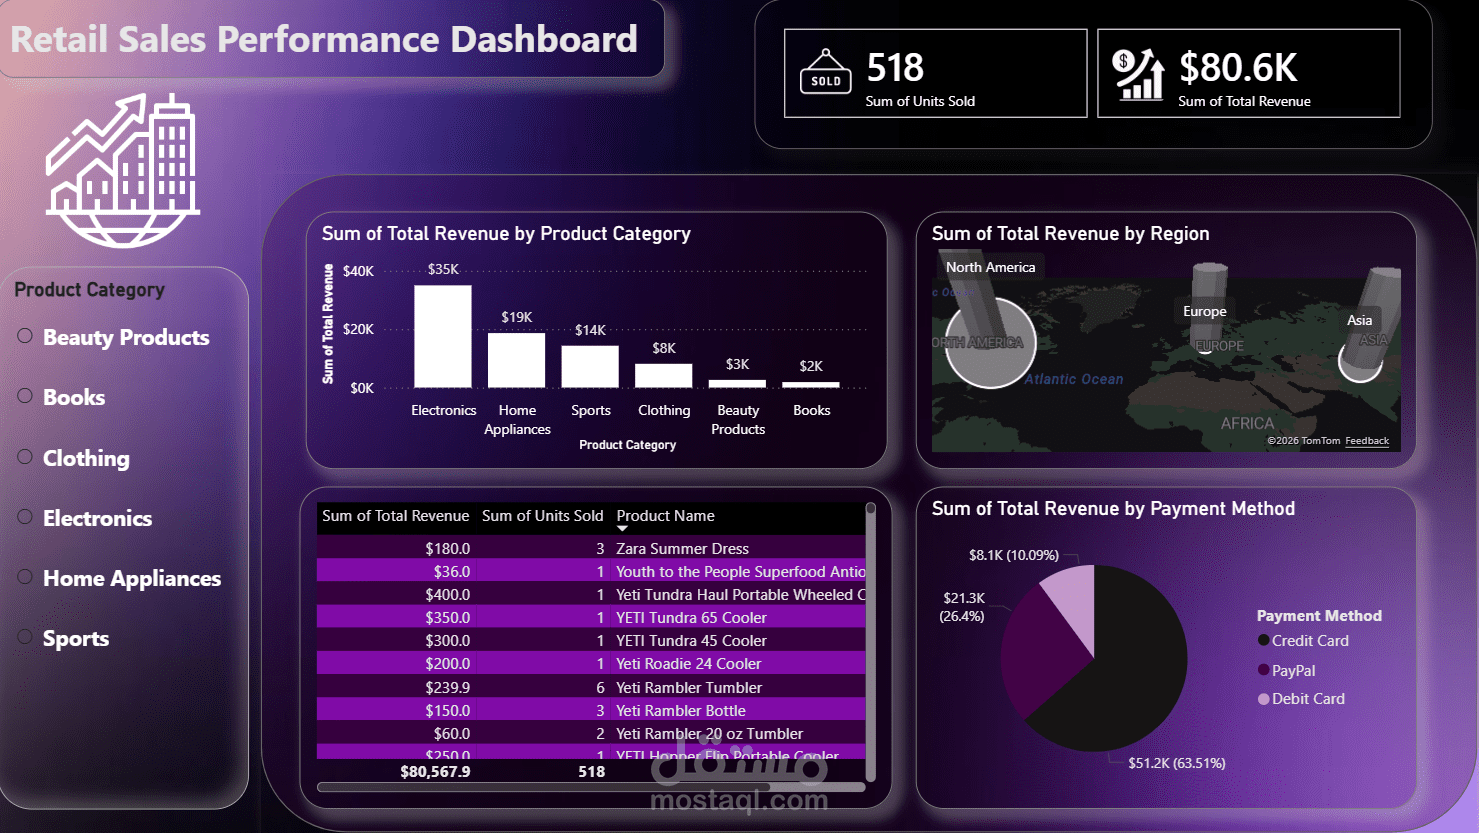
In this project, I transformed a raw retail dataset into a professional, interactive Power BI dashboard. The goal was to provide actionable insights into sales trends, regional performance, and customer payment behavior.
Key Contributions:
Data Cleaning (Power Query): Handled missing values, corrected data types, and performed text normalization (Trim/Clean) to ensure 100% data accuracy.
Dynamic Visuals: Developed a high-level overview featuring KPI cards for total revenue, regional sales maps, and category-wise performance charts.
Interactivity: Integrated slicers and filters to allow users to drill down into specific dates and regions for deeper analysis.
Tools Used: Power BI, Power Query, Excel.