Regional Sales Performance & Reps Productivity (Tableau)
تفاصيل العمل
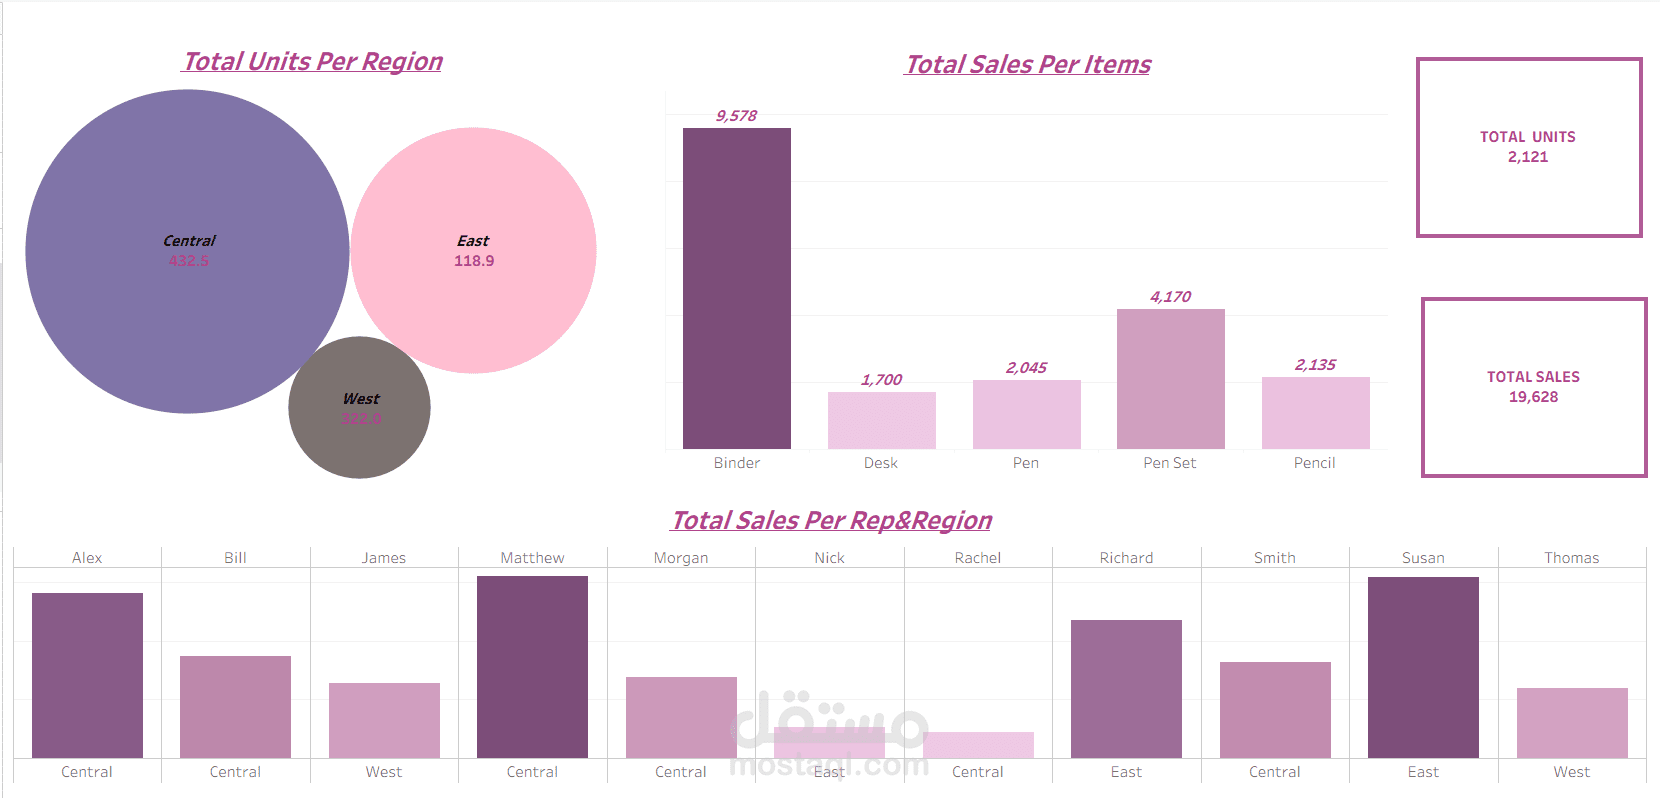
Project Overview:
A comprehensive sales operations analysis developed in Tableau, designed to monitor total sales volume and unit distribution across regions while evaluating sales representative productivity.
Key Contributions & Data Insights:
Regional Unit Distribution: Utilized Packed Bubble charts to visualize sales density, identifying the "Central" region as the leading territory.
Product Analysis: Tracked item performance, highlighting "Binders" as the top revenue generator with sales exceeding 9,500.
Sales Rep Productivity: Created a granular comparison of individual sales representatives across their respective regions (Central, East, West).
Core KPIs Tracking: Real-time monitoring of Total Sales ($19.6K+) and Total Units (2,121) to gauge overall business health.
Technical Stack: Fully developed using Tableau for advanced data visualization and interactive storytelling.