Coffee Shop Sales Analysis
تفاصيل العمل

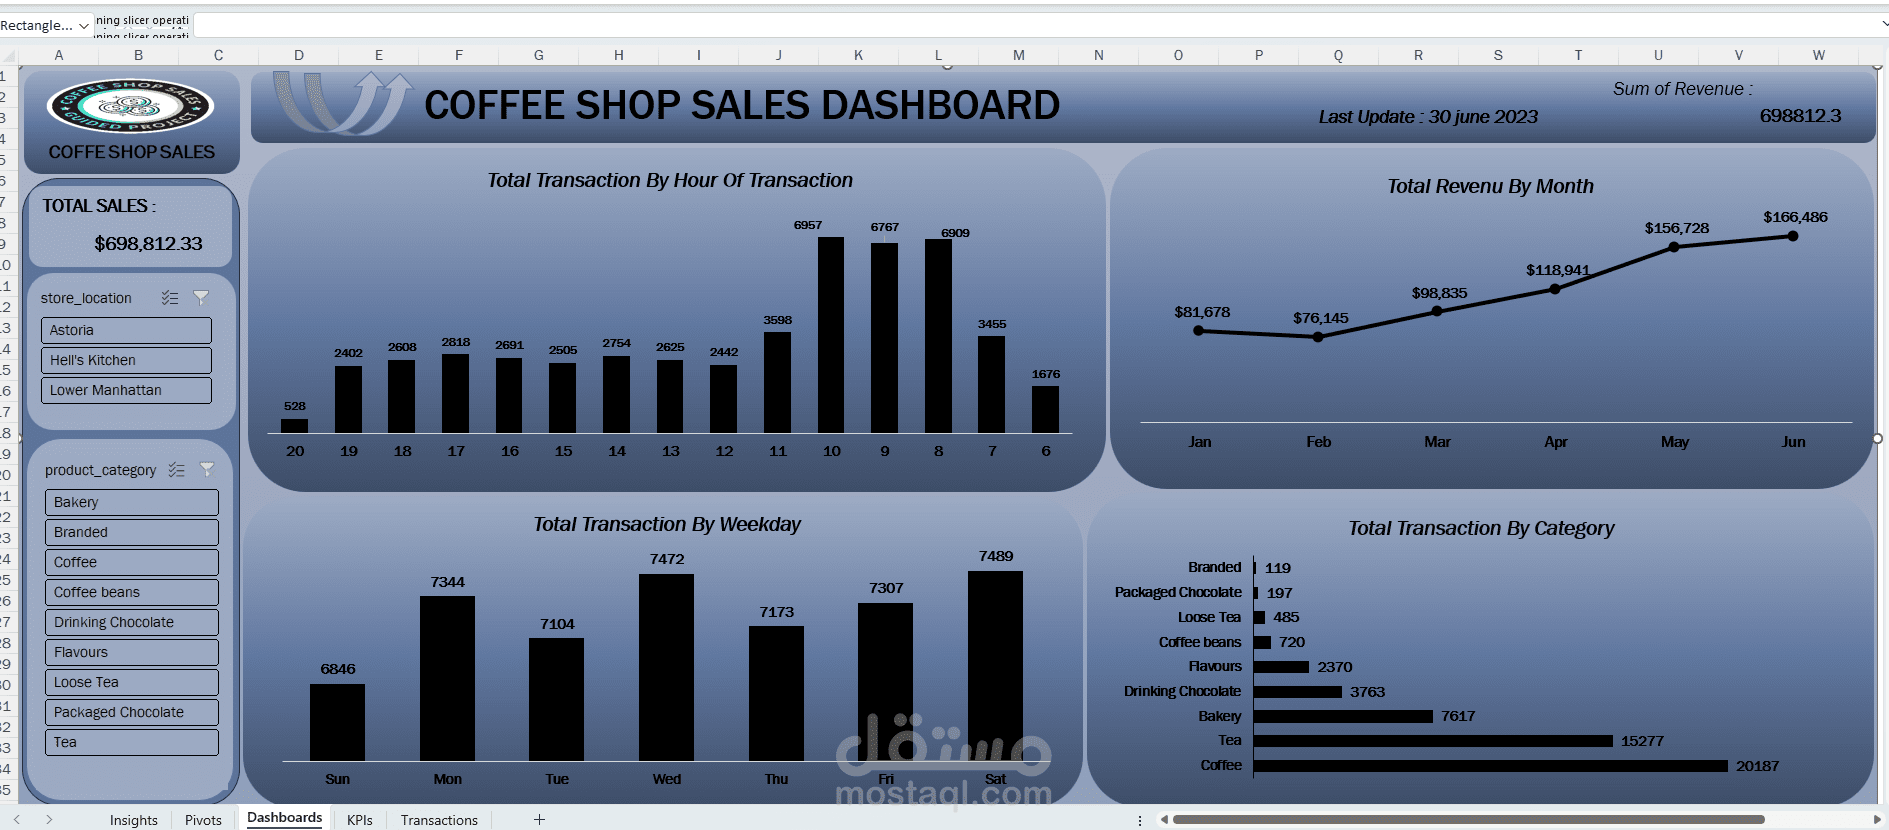
This project analyzes coffee shop sales data to identify sales patterns, top-performing products, and customer purchasing trends.
The dataset was cleaned and prepared using Microsoft Excel, followed by exploratory analysis using Pivot Tables and charts. An interactive dashboard was created to visualize key metrics such as total sales, product performance, and sales distribution over time.
The analysis helps highlight best-selling items and provides insights that can support inventory planning and promotional strategies.
Tools Used:
Excel, Pivot Tables, Data Visualization, Dashboard Design