Uber_Dashboard
تفاصيل العمل

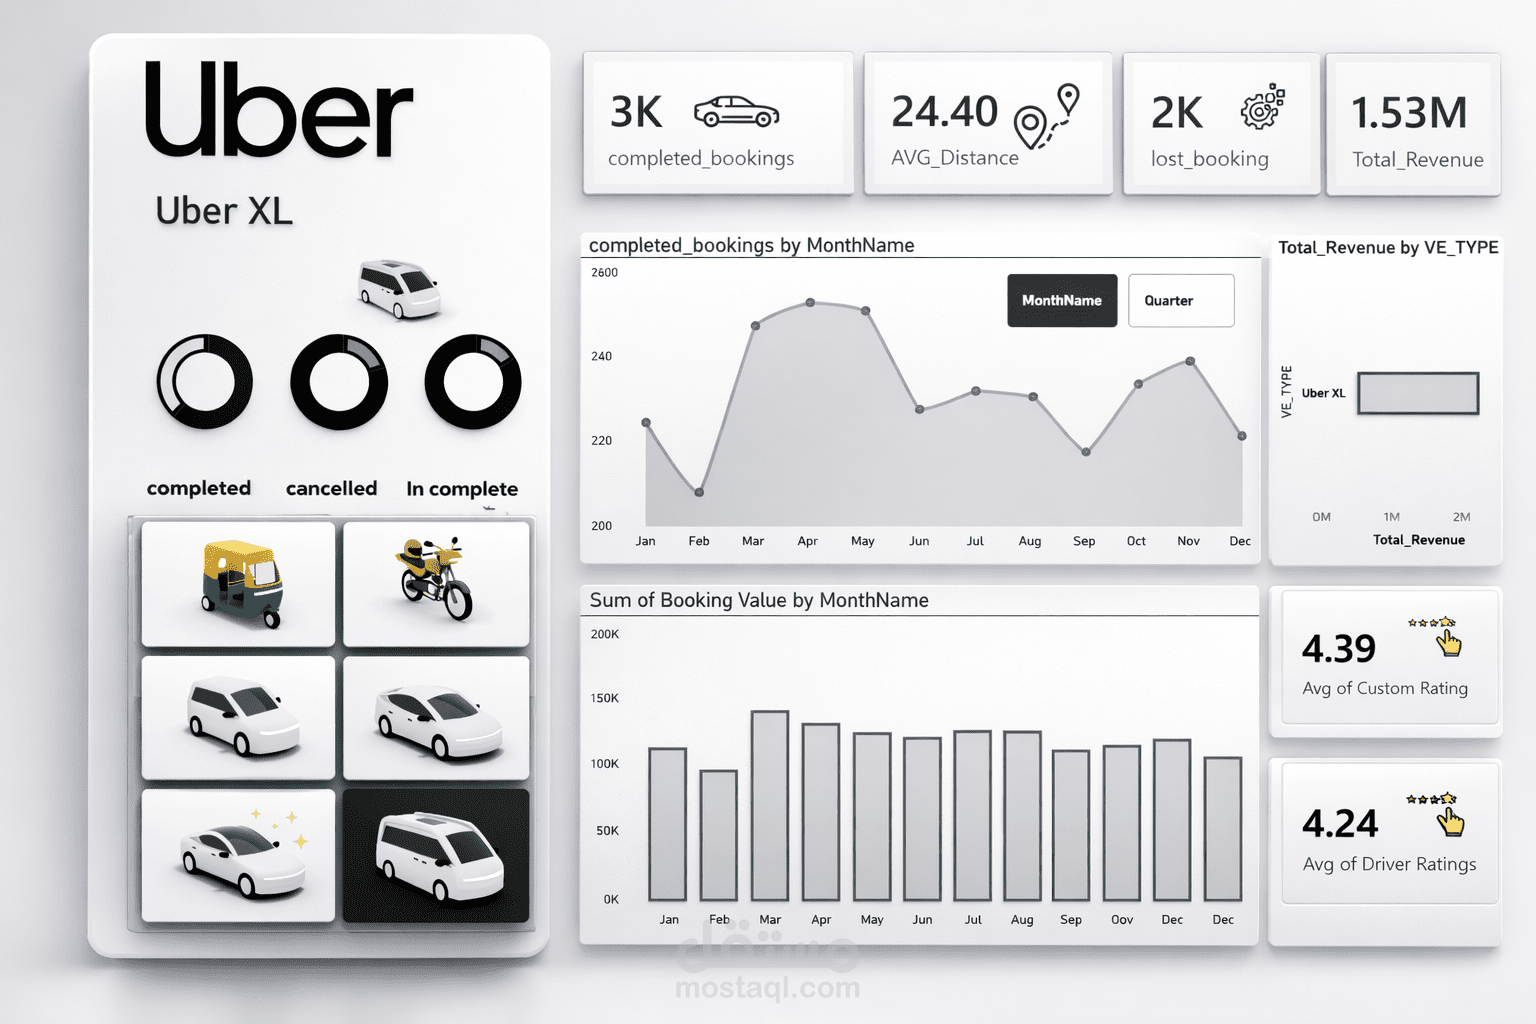
Uber Ride Analytics Dashboard
Tools: Power BI (DAX, Power Query), Excel | Timeline: 2–3 weeks
Problem: Operations team lacked a centralized view of ride performance, cancellations, and revenue trends across vehicle types
• Analyzed 150,000+ ride records to uncover patterns in completed, cancelled, and incomplete bookings
• Built an interactive Power BI dashboard tracking total revenue (9.37M), average distance, booking status, and vehicle performance
• Developed dynamic visuals by month, vehicle type, and booking status, enabling faster operational insights
• Created 10+ DAX measures including total revenue, completed bookings, lost bookings, and average ratings
• Identified key cancellation trends driven by customer behavior, supporting targeted service improvements
• Reduced manual reporting effort by providing a real-time performance monitoring tool used for decision-making