Sales Dashboard & Data Analysis for Retail Business Growth (Excel)
تفاصيل العمل

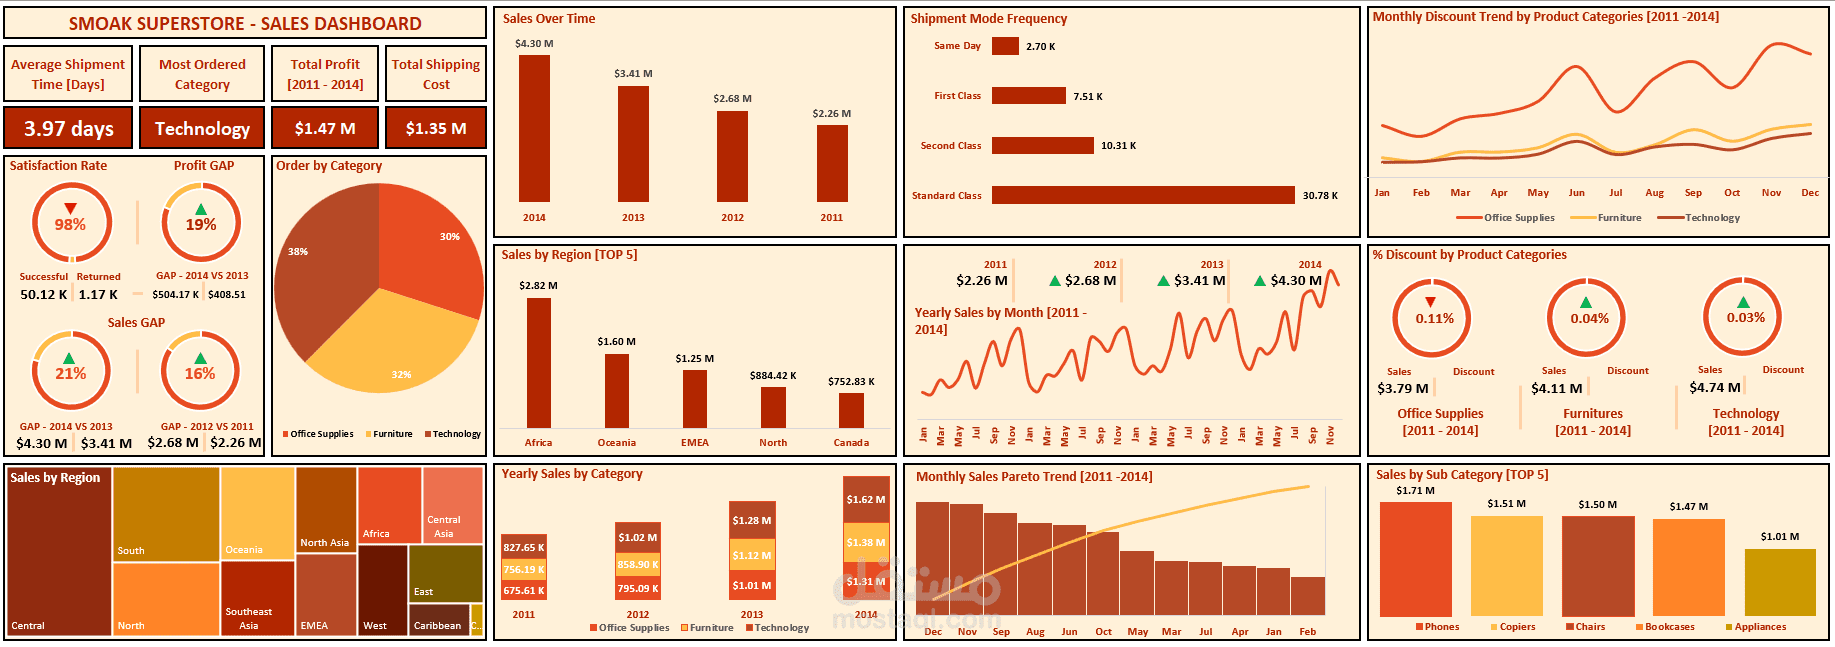
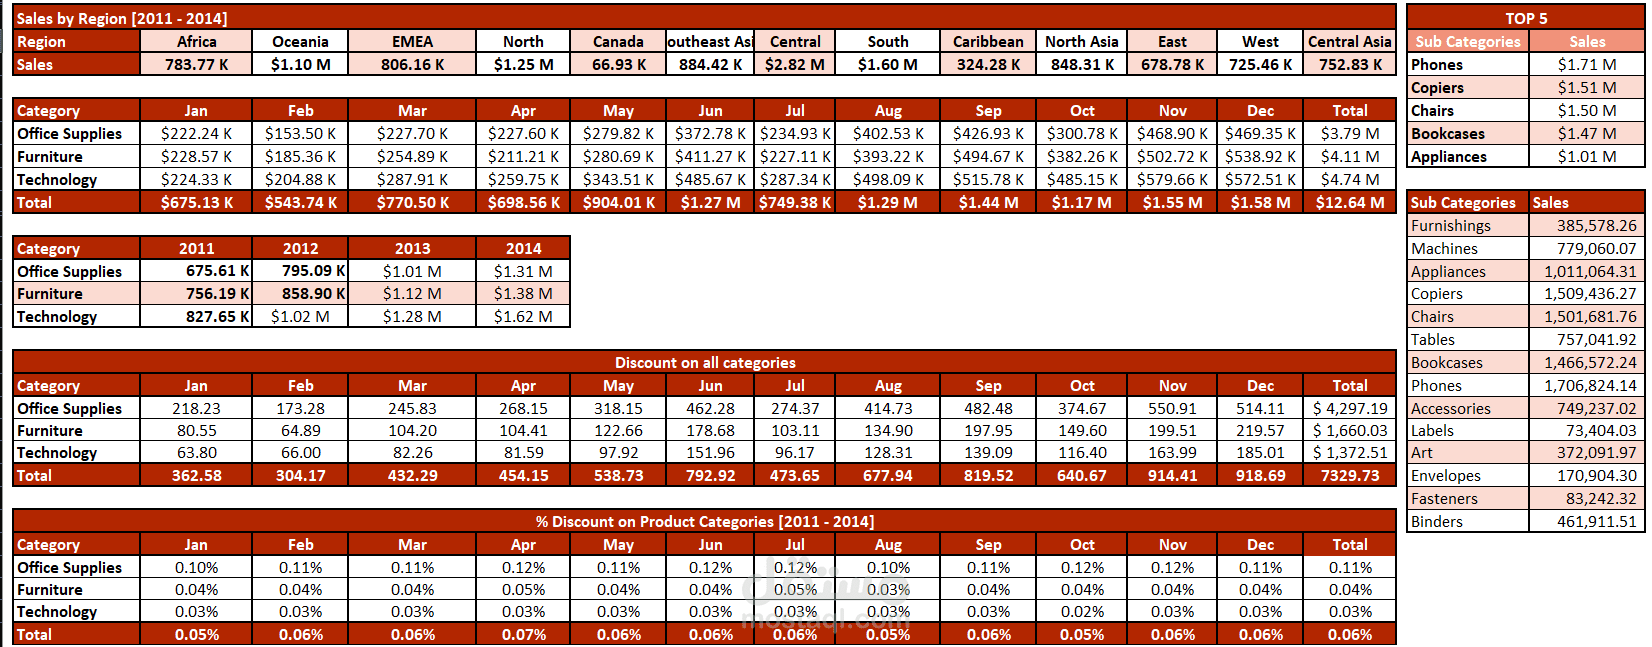
Designed a dynamic Excel dashboard to analyze 4 years of sales, profit, and shipment data for a retail business. The project identified key insights, including top-performing regions, product categories, and shipment trends, enabling data-driven decisions. Key findings showed a 90% sales increase over 4 years, high success in the Technology category, and areas for operational improvement. The dashboard featured KPIs, visual trends, and actionable insights for stakeholders.