Sales Analsis
تفاصيل العمل
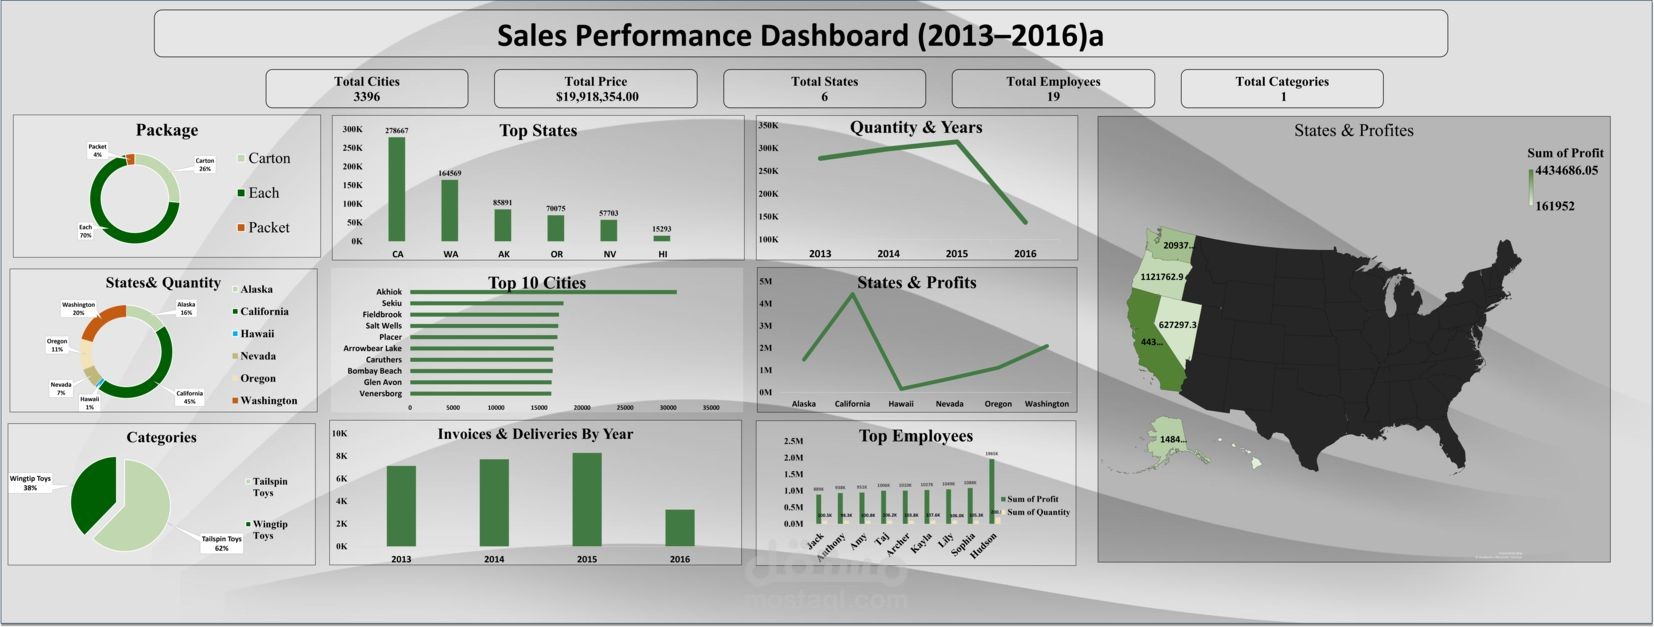
I built this sales performance dashboard in Excel with a strong focus on proper data modeling and analysis.
The work started with cleaning and transforming the data using Power Query, then building a data model by separating fact and dimension tables and creating clear relationships to support accurate analysis.
This structure made it easier to analyze sales, profit, and quantity across time, locations, customers, and employees, and ensured the results were consistent and reliable.
The goal was not just to visualize data, but to build a solid analytical foundation that supports meaningful business insights.
All data of project with analysis on github