Executive Sales & Profitability Dashboard (2014–2017)
تفاصيل العمل
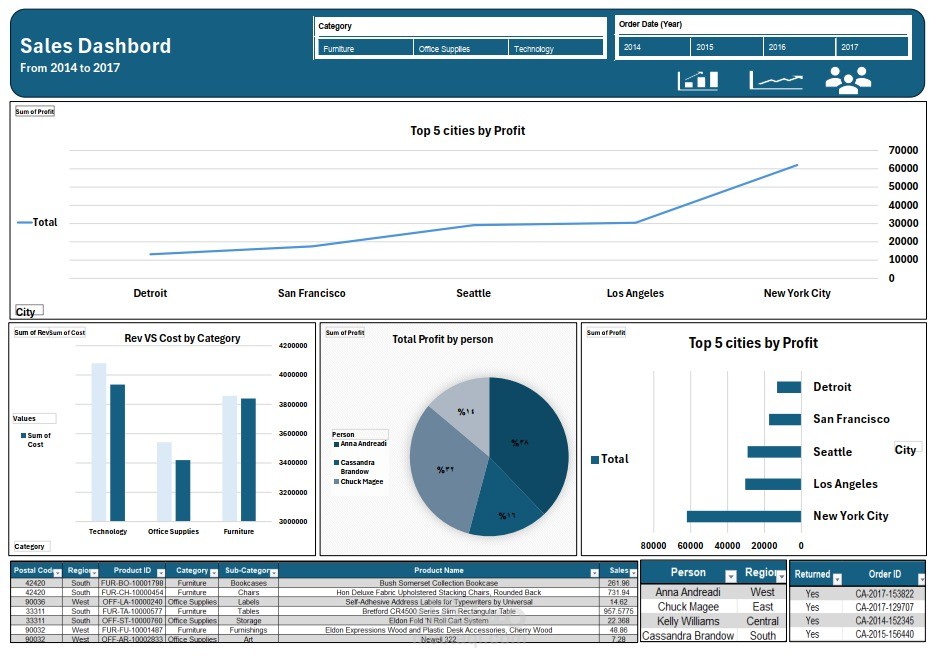

Executive Sales & Profitability Dashboard (2014–2017)
This interactive dashboard provides a comprehensive analysis of sales and profitability performance across multiple business dimensions.
What This Dashboard Covers:
Top 5 Cities by Profit
Revenue vs Cost Comparison
Sales Representative Performance
Yearly Profit Trend Analysis
Dynamic Filtering by Category & Year
Strategic Value:
Highlights the most profitable markets
Identifies cost inefficiencies
Tracks sales team contribution
Supports data-driven financial planning
Enables executive-level decision-making
Designed For:
Business owners, managers, and executives who need clear financial visibility and performance monitoring in one interactive solution.