إدخال بيانات- Excel Sheet and Dashboard
تفاصيل العمل
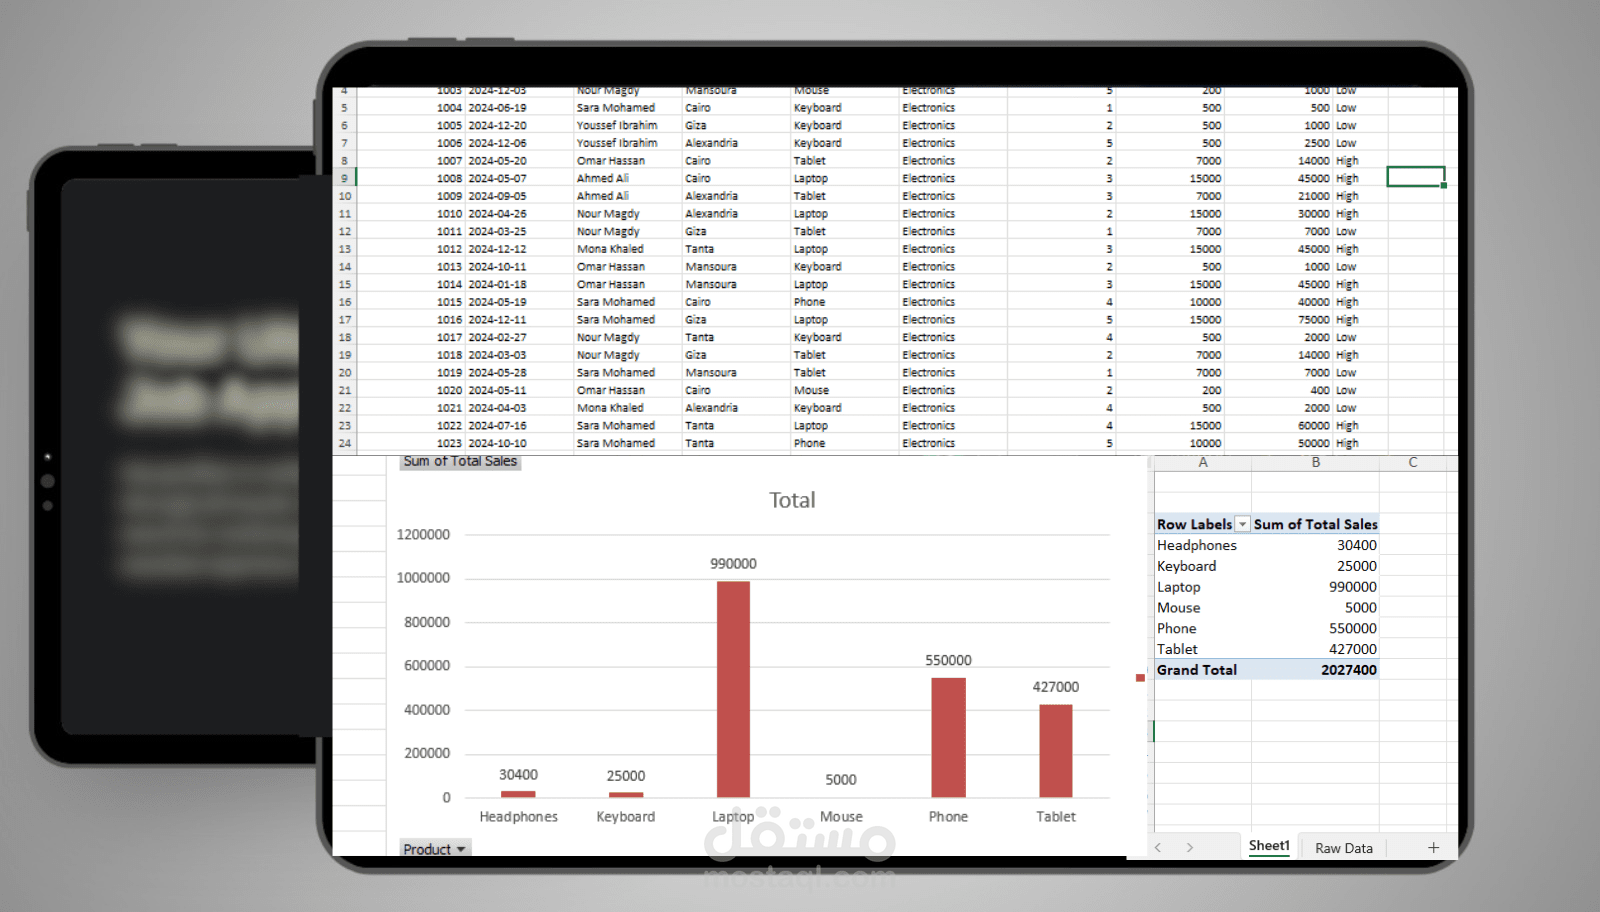
This project presents a sales data analysis performed using Microsoft Excel. The dataset was organized, analyzed, and transformed into meaningful insights using professional Excel tools and functions.
The work includes data structuring, formula implementation, Pivot Tables, and data visualization through charts to clearly analyze sales performance by product. The goal of this project is to demonstrate the ability to convert raw data into clear analytical results that support decision-making.
Skills demonstrated in this project:
• Data organization and cleaning in Excel
• Using logical and statistical formulas (IF, SUM, AVERAGE, COUNTA)
• Creating and analyzing Pivot Tables
• Data visualization using charts
• Presenting analytical results in a clear and structured format
This project reflects my practical skills in using Microsoft Excel for data analysis and reporting.