Sales Performance Dashboard
تفاصيل العمل
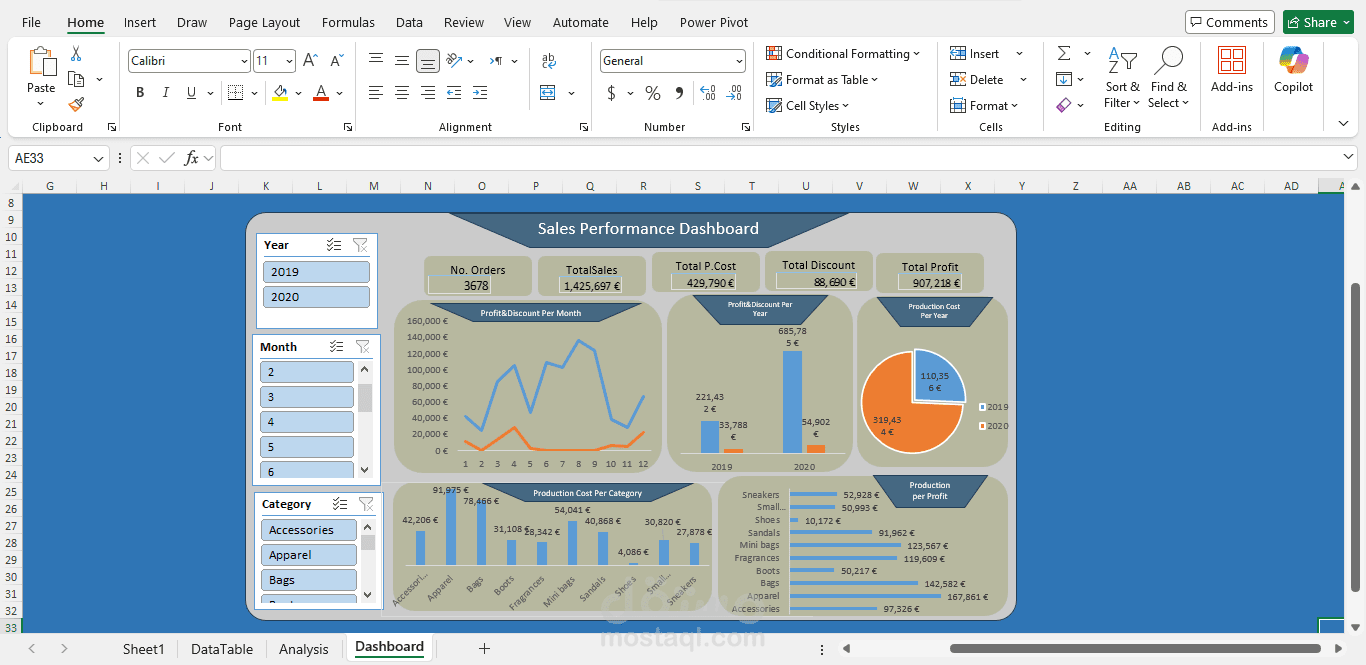
What the Dashboard Shows
This is an Excel-based Sales Performance Dashboard that gives a comprehensive overview of business operations across two years (2019 and 2020), with interactive filters for Year, Month, and Category.
Key Metrics at the Top (KPI Cards):
No. Orders: 3,678 total orders
Total Sales: €1,425,697
Total Production Cost: €429,790
Total Discount: €88,690
Total Profit: €907,218 — a very healthy ~63% profit margin
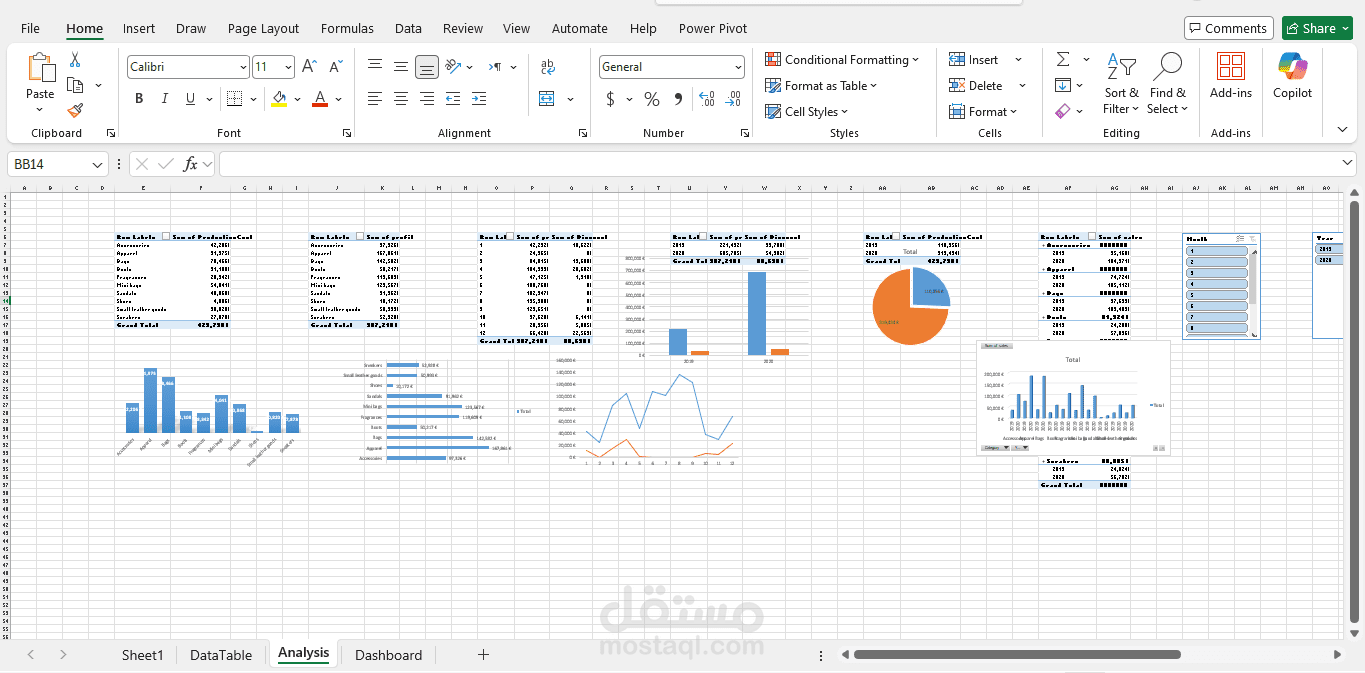
Charts & Visuals Included:
Profit & Discount Per Month — a line chart tracking monthly fluctuations, helping spot seasonal peaks and slow periods
Profit & Discount Per Year — a bar chart comparing 2019 vs. 2020 performance directly
Production Cost Per Year — a pie/donut chart showing cost distribution between the two years
Production Cost Per Category — a bar chart breaking down costs across Accessories, Apparel, Bags, Boots, Fragrances, Mini Bags, Sandals, Shoes, Small items, and Sneakers
Production Per Profit — a horizontal bar chart ranking each product category by profitability, with Apparel (€167,861) and Bags (€142,582) leading
How This Dashboard Drives Company Growth
1. Smarter Inventory & Production Decisions
By seeing which categories cost the most to produce vs. how much profit they return, management can redirect investment toward high-margin products like Apparel and Bags and reduce overproduction in lower-margin lines.
2. Seasonal Strategy
The monthly profit/discount trend line reveals peak sales months, allowing the company to time promotions, stock up inventory, and allocate marketing budgets more effectively — rather than guessing.
3. Discount Optimization
With €88,690 in total discounts tracked alongside profit, leadership can see exactly whether discounts are driving volume or just eroding margin, enabling smarter pricing decisions.
4. Year-over-Year Benchmarking
Comparing 2019 vs. 2020 directly lets executives measure growth, identify whether the business is scaling, and hold teams accountable to targets.
5. Category-Level Accountability
The category filters allow sales and product teams to drill into specific lines (e.g., Sneakers, Sandals) and identify underperformers early — before they drag overall profitability down.
6. Fast, Data-Driven Leadership
Instead of manually compiling reports, executives get a single-screen snapshot of the entire business, reducing decision latency and enabling faster, more confident strategic moves.