Food Delivery Analysis
تفاصيل العمل
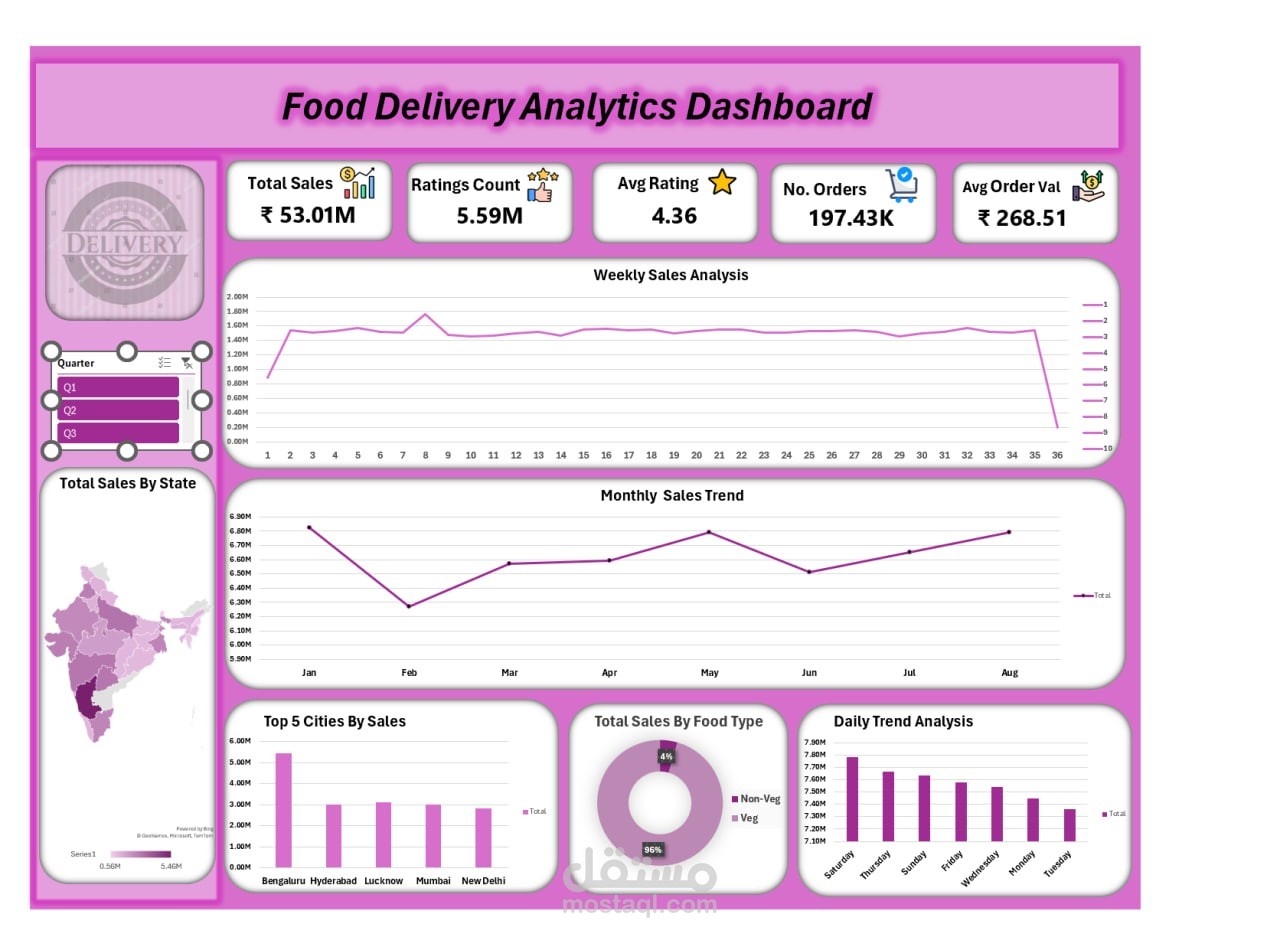
This dashboard provides a complete analysis of food delivery data, focusing on understanding sales performance, customer behavior, and business trends.
? Key KPIs:
Total Sales
Total Orders
Average Order Value
Average Rating
Ratings Count
? Insights & Visualizations:
Monthly & Weekly Sales Trends
Daily Trend Analysis
Total Sales by Food Type (Veg vs Non-Veg)
State-wise Sales Distribution (Map)
Quarterly Performance Summary
Top 5 Cities by Sales
? Tools Used: Excel
This project helped me improve my skills in data cleaning, modeling, visualization, and storytelling with data