Dashboard
تفاصيل العمل
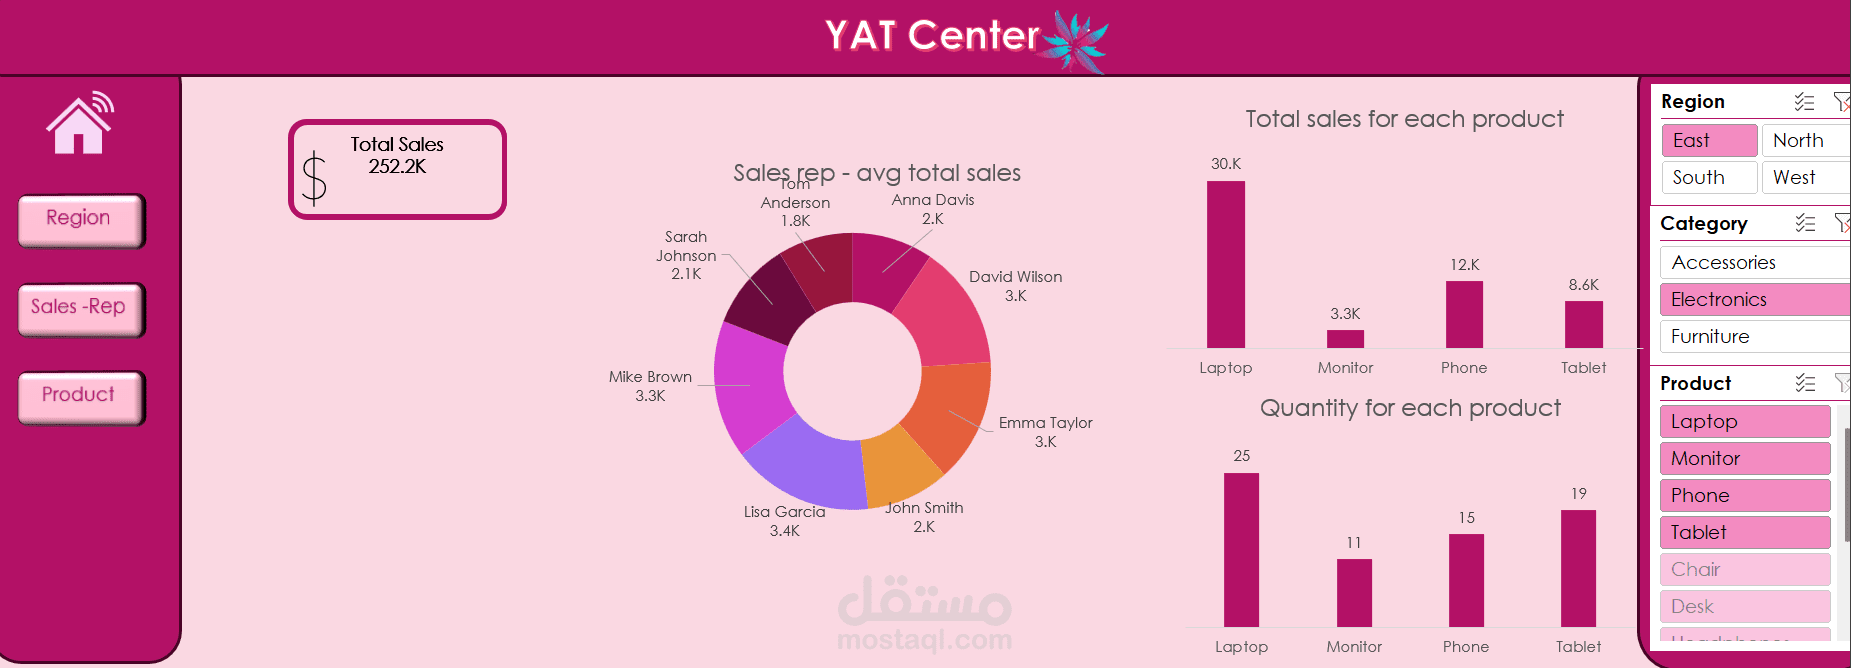
The YAT Center Sales Dashboard is an interactive data visualization project designed to analyze and monitor sales performance across different regions, product categories, and sales representatives. The dashboard highlights key metrics such as total sales (252.2K), average sales per sales representative, total sales by product, and quantity sold per product. It features dynamic filters for region, category, and product, allowing users to explore the data and gain deeper insights. Through KPI cards, bar charts, and a donut chart, the project provides a clear and structured overview of business performance, helping decision-makers identify top-performing products, evaluate sales team contributions, and make data-driven strategic decisions.