Sales Data Analyst | Dashboard & Business Insights
تفاصيل العمل
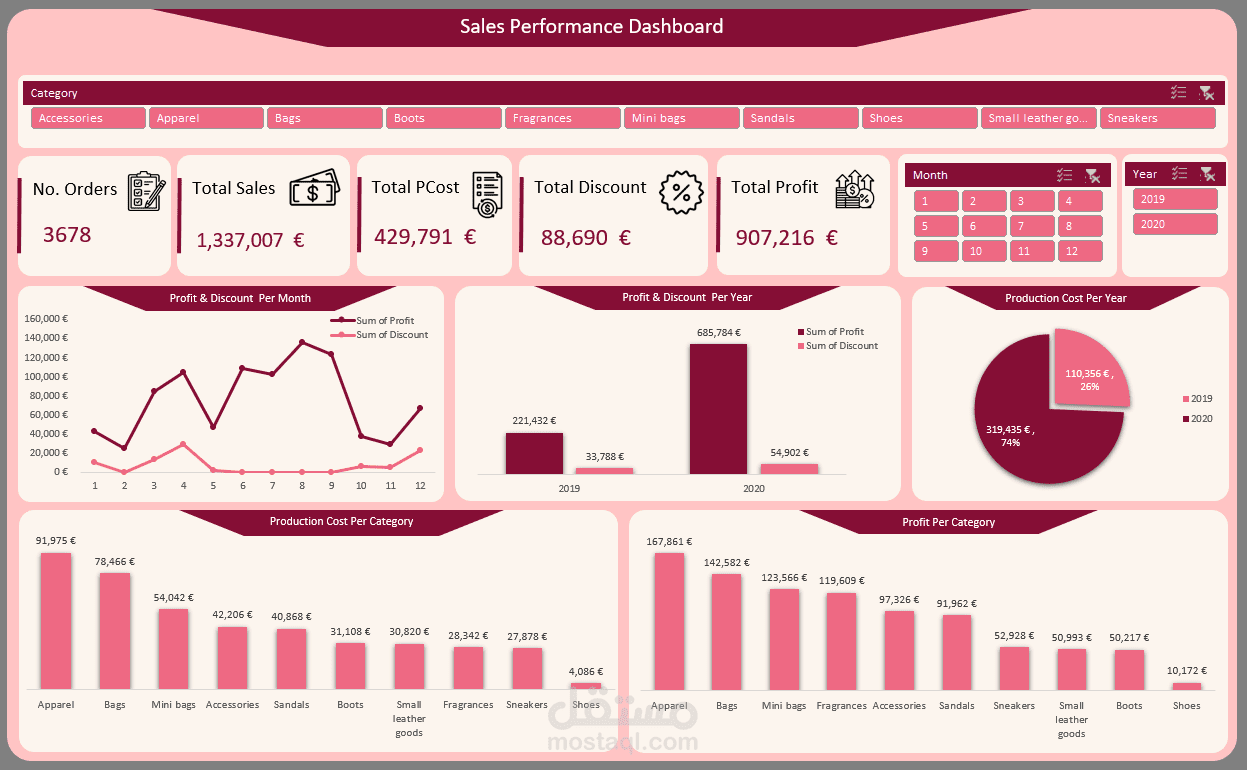
Designed and developed an interactive Sales Performance Dashboard using Microsoft Excel to analyze key business metrics across multiple product categories and time periods. The dashboard provides clear insights into total sales, number of orders, production costs, discounts, and overall profitability.
Performed data cleaning, organization, and analysis using Excel tools such as Pivot Tables, formulas, and data visualization features. Built dynamic charts to track monthly and yearly performance, as well as category-level comparisons.
This project supports data-driven decision-making by identifying trends, highlighting high-performing categories, and finding ways to improve profitability and cost efficiency.
قمت بتصميم وتطوير لوحة معلومات تفاعلية لأداء المبيعات باستخدام Microsoft Excel لتحليل المؤشرات الرئيسية للأعمال عبر فئات منتجات متعددة وفترات زمنية مختلفة، حيث توفر اللوحة رؤى واضحة حول إجمالي المبيعات، عدد الطلبات، تكاليف الإنتاج، الخصومات، وصافي الأرباح.
قمت بتنظيف البيانات وتنظيمها وتحليلها باستخدام أدوات Excel مثل الجداول المحورية (Pivot Tables) والمعادلات والرسوم البيانية، بالإضافة إلى إنشاء تصورات ديناميكية لمتابعة الأداء الشهري والسنوي ومقارنة أداء الفئات المختلفة.
يساعد هذا المشروع في دعم اتخاذ القرارات المبنية على البيانات من خلال اكتشاف الاتجاهات، وتحديد الفئات الأعلى أداءً، وإيجاد طرق لتحسين الربحية وكفاءة التكاليف.