Comprehensive Total Sales & Profitability Analysis Dashboard
تفاصيل العمل
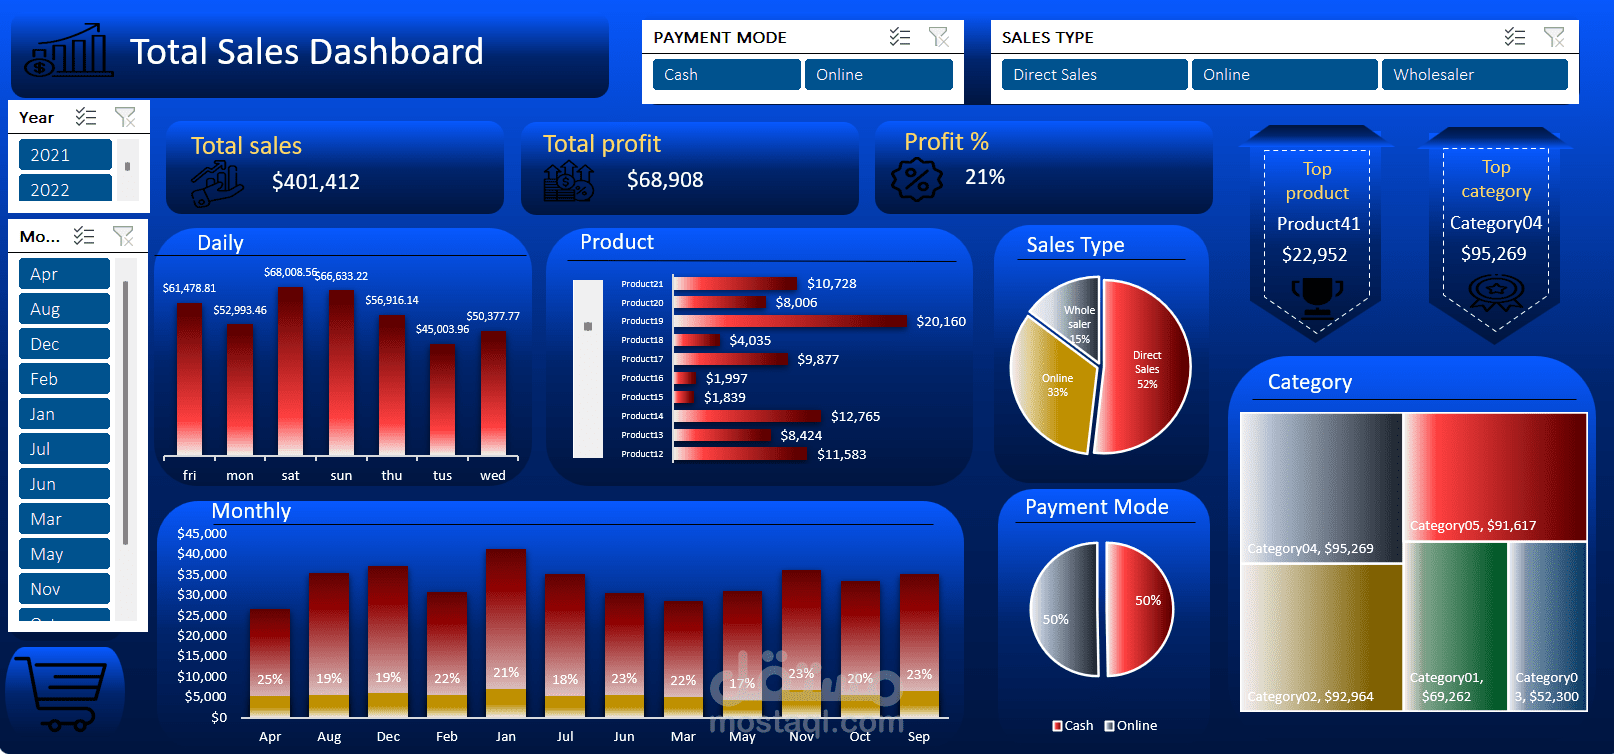
A high-impact Executive Sales Dashboard built entirely in Microsoft Excel, focused on financial performance and profitability. This project provides a deep dive into revenue streams, profit margins, and sales operations across different payment modes and distribution channels.
Key Metrics & Analytics:
Financial Performance: Tracked total sales of $401,412 with a total profit of $68,908, maintaining a solid 21% Profit Margin.
Sales Segmentation: Visualized revenue distribution by Sales Type, highlighting that Direct Sales account for 52% of the business.
Payment Insights: Analyzed customer behavior through a 50/50 split between Cash and Online payment modes.
Inventory & Category Performance: Identified the top-performing category (Category04) with $95,269 in revenue and the leading product (Product41).
Temporal Trends: Interactive monthly and daily charts showing sales fluctuations, with peak performance analyzed across 2021 and 2022.
Advanced Visuals: Utilized custom Excel Treemaps for category breakdown and Donut Charts for proportion analysis to ensure quick data digestibility.
Tools & Techniques Used:
Data Visualization: Microsoft Excel (Advanced Dark Theme UI Design).
Data Processing: Power Query for cleaning and transforming raw sales data.
Core Logic: Pivot Tables & Pivot Charts for dynamic data aggregation.
Advanced Formulas: Utilized complex Excel functions to calculate Profit % and Year-over-Year (YoY) metrics.
Interactivity: Integrated Slicers and Timelines for a seamless, user-friendly filtering experience.