Dynamic Sales Performance & Revenue Distribution Dashboard
تفاصيل العمل
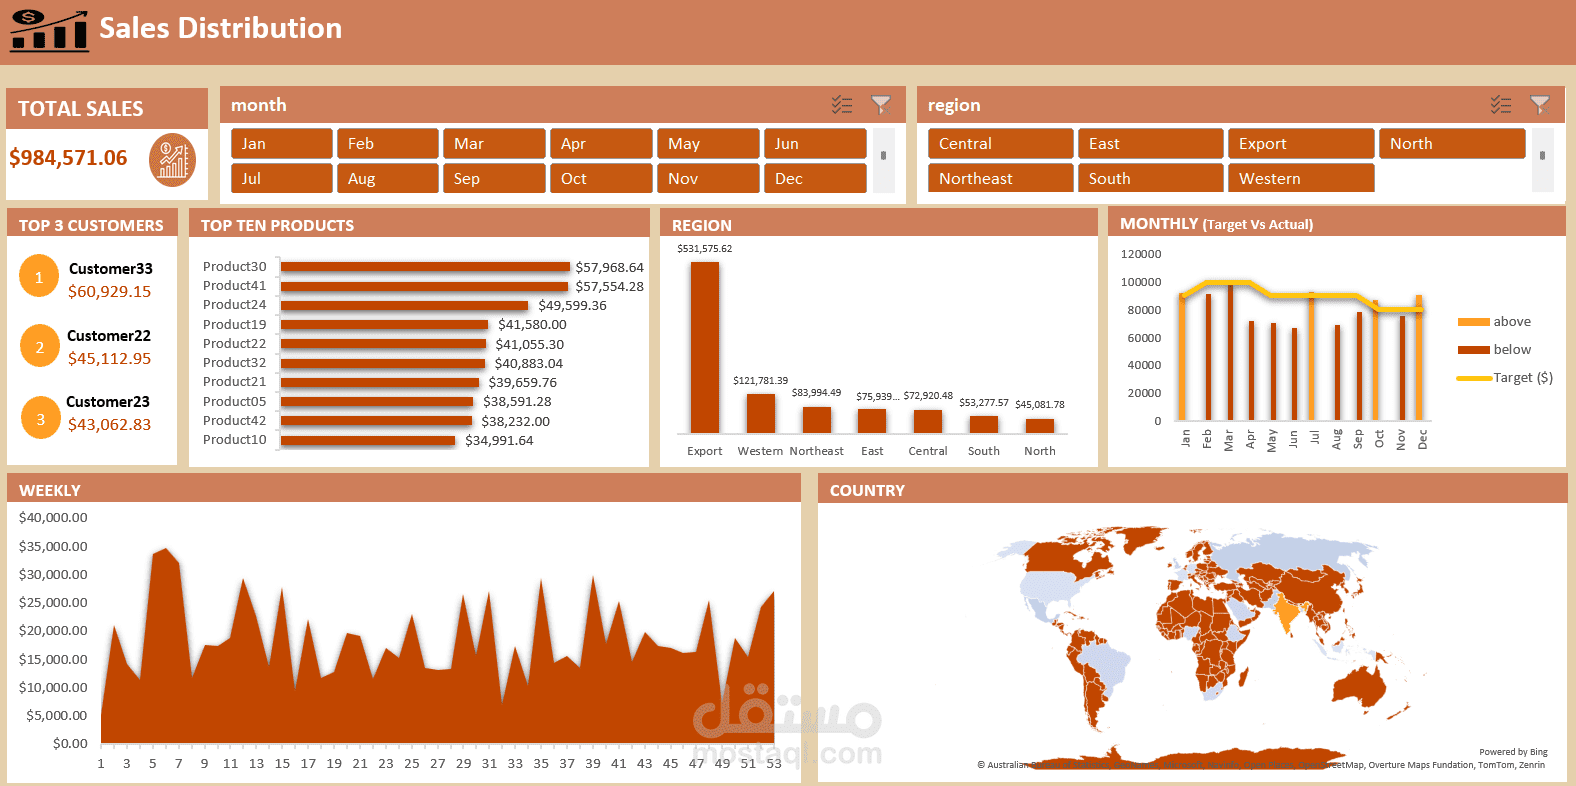
A professional Sales Analytics Dashboard designed to monitor global sales performance and track revenue metrics. The dashboard provides a high-level view of financial health while allowing for granular analysis of products, regions, and customer behavior.
Key Insights & Technical Details:
Total Revenue Tracking: Real-time monitoring of total sales reaching over $984K.
Geographic Analysis: An interactive World Map and regional breakdown to identify high-performing markets like the Export region, which leads with over $531K in sales.
Product Performance: Analysis of the Top Ten Products, identifying "Product30" as the top generator with $57,968.64.
Customer Segmentation: Tracking the Top 3 Customers to understand high-value accounts (e.g., Customer33 with $60,929.15).
Target vs. Actual Analysis: A monthly comparison of sales against set financial targets to visualize performance gaps and achievements.
Time-Series Forecasting: Visualizing weekly sales trends (1-53 weeks) to identify seasonal spikes and business cycles.
Tools Used:
Data Visualization: Excel.
Geospatial Mapping: Bing Maps integration for country-level distribution.