Customer Experience & Feedback Analytics Dashboard
تفاصيل العمل
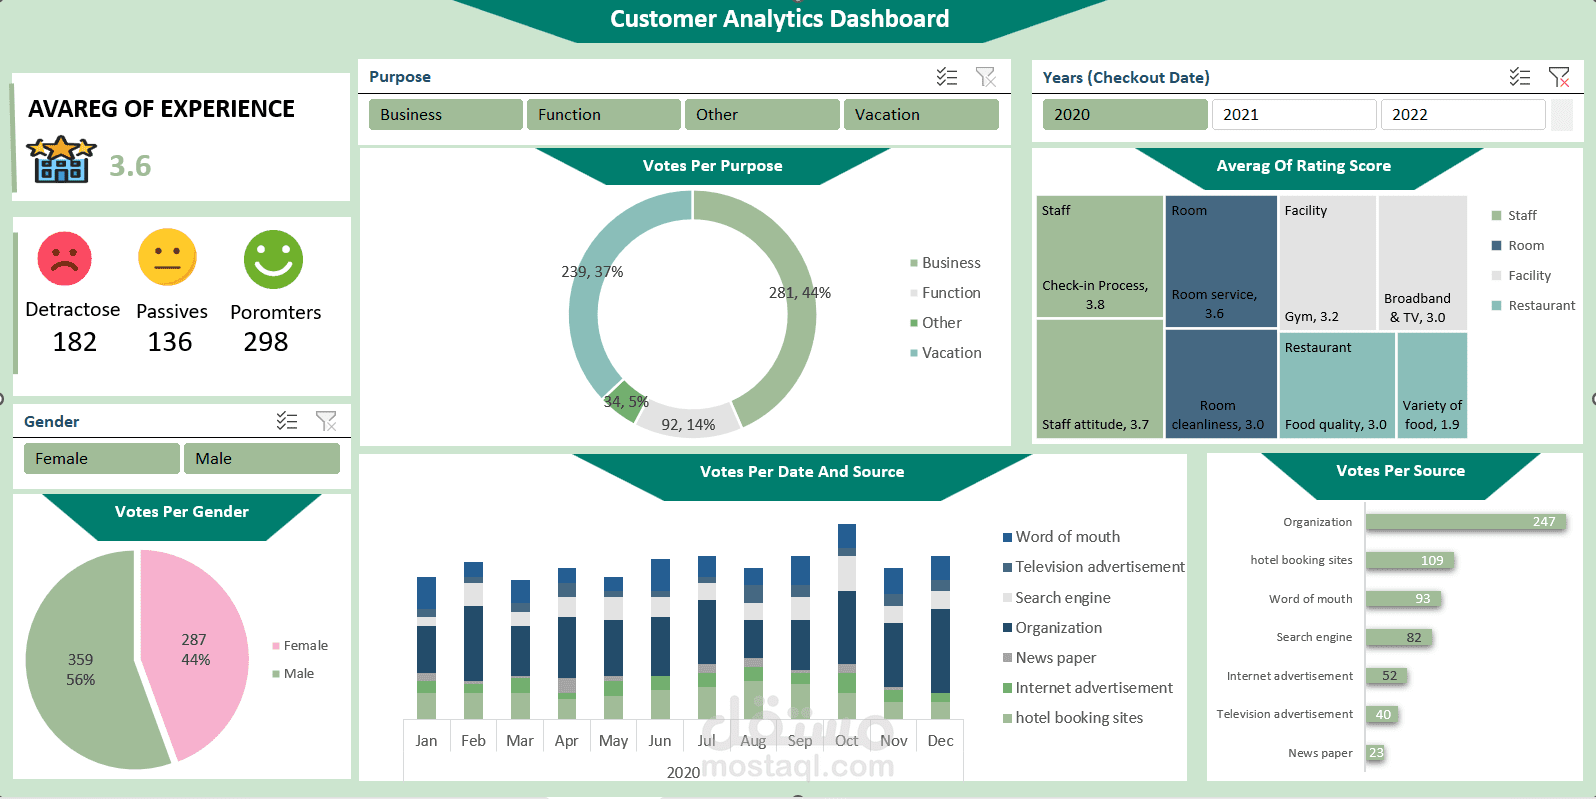
Developed a comprehensive Interactive Data Dashboard to analyze hotel customer feedback and experience metrics. The project transforms raw customer data into actionable insights to improve service quality and customer satisfaction.
Key Features & Insights:
Net Promoter Score (NPS) Analysis: Visualizing customer loyalty by categorizing feedback into Promoters, Passives, and Detractors.
Multi-Dimensional Filtering: Built dynamic slicers for Gender, Purpose of Visit (Business, Vacation, etc.), and Time Periods (2020-2022) for deep-dive analysis.
Performance Benchmarking: Detailed rating breakdown for specific services like Staff Attitude, Room Cleanliness, Food Quality, and Facility usage.
Trend Analysis: A monthly breakdown of "Votes Per Date and Source" to identify seasonal trends and the effectiveness of different marketing channels (Word of mouth, Booking sites, etc.).
Demographic Profiling: Gender-based distribution of votes to understand the customer base better.
Tools Used:
Data Visualization: Microsoft Excel.
Data Cleaning: Power Query.
Analysis: Statistical analysis of rating scores and customer feedback trends