Amazon Sales Performance Dashboard | Power BI, SQL, Excel
تفاصيل العمل
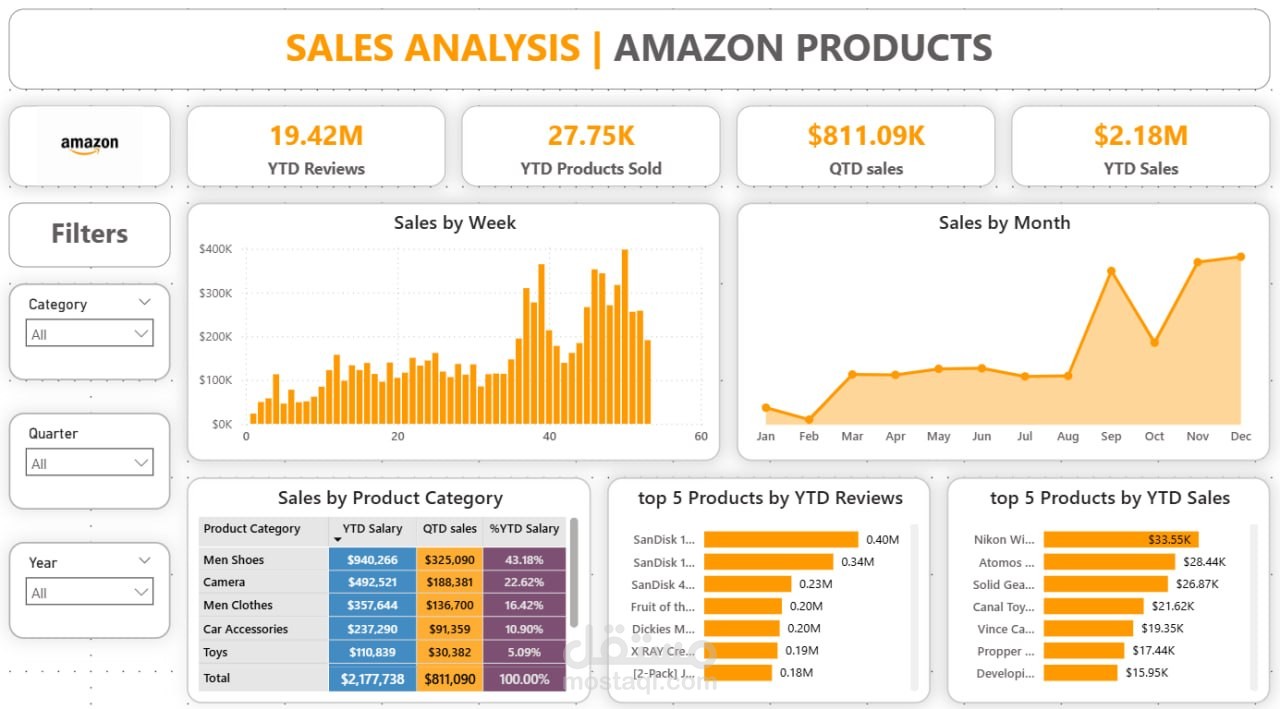
Built YTD and QTD KPIs using DAX to track sales performance
• Designed weekly and monthly trend visuals for top-selling products
• Identified top 5 products contributing to total revenue
• Created dynamic KPI cards and drill-through product detail tables
• Automated data cleaning and transformation using Power Query for accuracy
-- Key KPIs:
✅ YTD Sales
✅ QTD Sales
✅ YTD Products Sold
✅ YTD Reviews
-- Sales Performance Analysis:
Sales by Week → Helps identify short-term trends and promotional impact.
Sales by Month → Tracks seasonality and long-term growth patterns.
-- Product Performance Insights:
Top 5 Products by YTD Sales
Top 5 Products by YTD Reviews
-- Detailed Product Table:
The dashboard also includes a structured table with:
YTD Sales
QTD Sales
% Contribution to Total YTD Sales