Sales Dashboard Analysis (2019–2020) | Excel Data Analytics Project
تفاصيل العمل
? Project Overview
My first data analytics dashboard project, created during my internship with DEPI. The project analyzes Fruit & Vegetables product sales data (2019–2020) across multiple countries using Microsoft Excel.
The goal of this project is to demonstrate my ability to:
Clean and structure raw sales data
Perform exploratory data analysis
Build interactive dashboards
Extract meaningful business insights using Excel
? Internship Details
Internship Organization: DEPI
Role: Data Analyst Intern
Tool Used: Microsoft Office Excel
? Dataset Description
The dataset represents product sales transactions for Fruit and Vegetables across the following countries:
Australia
Canada
Egypt
France
Germany
New Zealand
United Kingdom
United States
? Dataset Columns: Column Name Description Order ID Unique identifier for each order Date Transaction date Product Product name (Apple, Banana, Broccoli, etc.) Category Fruit or Vegetables Country Country of sale Region East, West, North, South Month Month of transaction Year Year (2019–2020) Quarter Q1–Q4 Amount Sales amount (USD) ? Dashboard Features
The Excel dashboard provides an interactive analysis of sales performance, including:
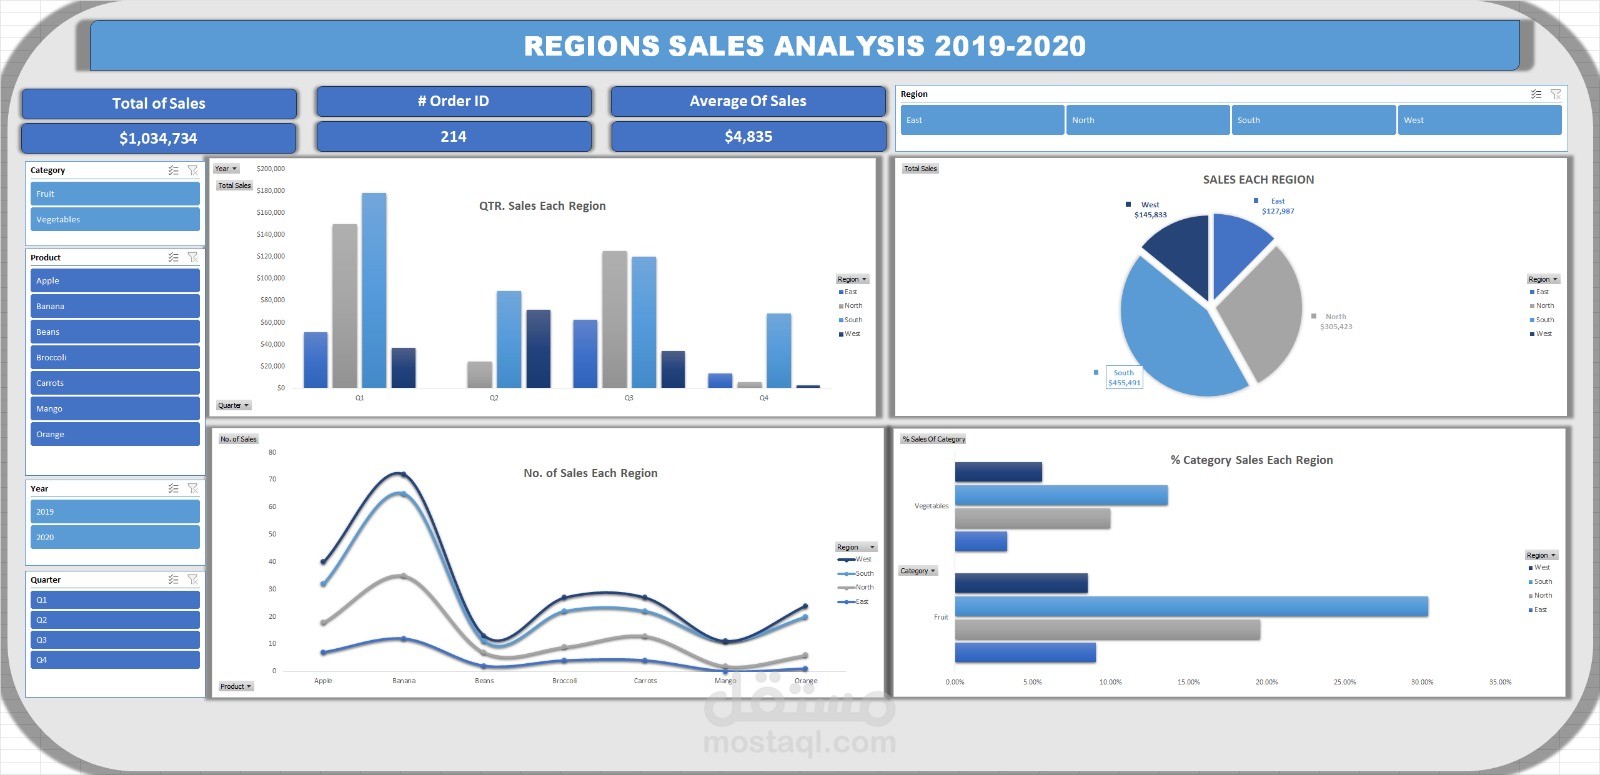
✅ Key Performance Indicators (KPIs)
Total Sales: $1,034,734
Total Orders: 214
Average Sales per Order: $4,835
? Visualizations Included
Quarterly Sales by Region (Column Chart)
Total Sales Distribution by Region (Pie Chart)
Number of Sales per Product & Region (Line Chart)
Category Sales Percentage by Region (Bar Chart)
? Interactive Filters (Slicers)
Year (2019, 2020)
Quarter (Q1–Q4)
Region
Product
Category
? Tools & Techniques Used
Microsoft Excel
Pivot Tables
Pivot Charts
Slicers & Filters
Data Cleaning & Formatting
Dashboard Design & Layout
? Key Insights
The South region generated the highest total sales.
Fruit products outperformed Vegetables across most regions.
Sales peaked during Q3, especially in 2019.
Apples and Bananas were the top-performing products.
? Repository Structure ? Sales-Dashboard-Excel │ ├── ? Sales_Dashboard.xlsx # Interactive Excel dashboard ├── ? Raw_Sales_Data.xlsx # Original dataset ├── ? Dashboard_Screenshot.png # Dashboard image preview └── README.md # Project documentation
? Project Objective
This project was created to:
Apply data analytics concepts learned during my internship
Showcase Excel dashboarding skills
Build a strong portfolio project for data analyst roles
? Future Improvements
Automate data updates using Power Query
Migrate dashboard to Power BI
Add profitability and trend forecasting analysis