Coffee Shop Performance & Sales Analytics Dashboard
تفاصيل العمل
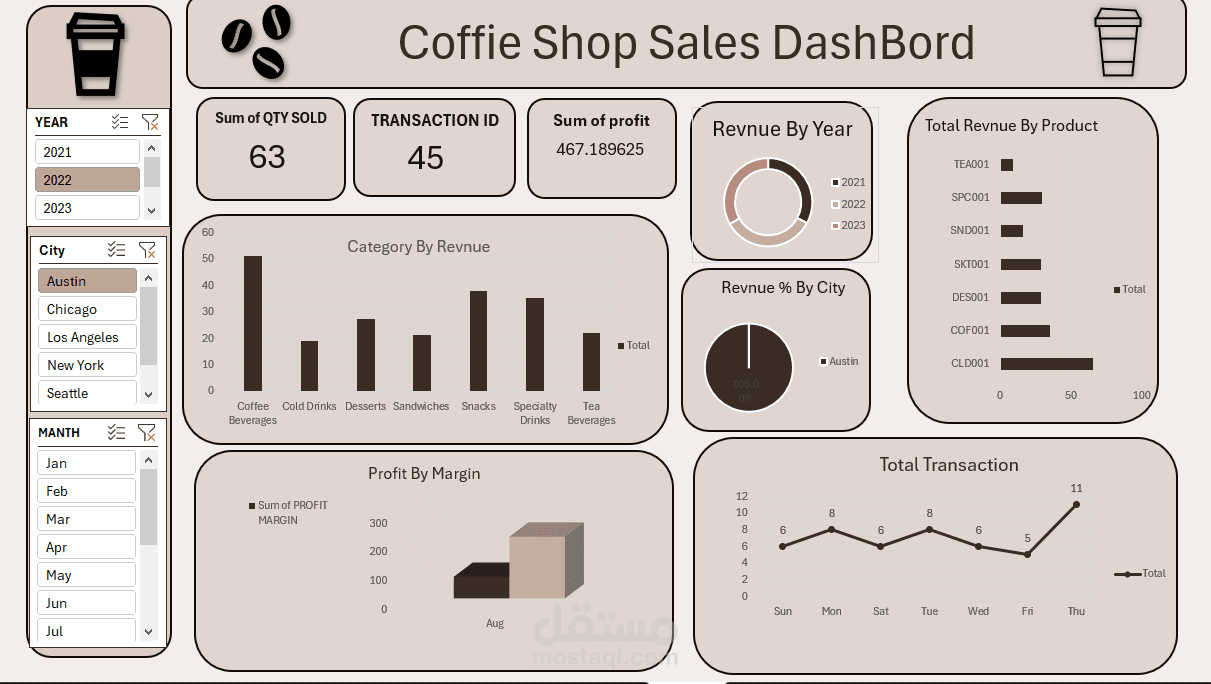
Coffee Shop Performance & Sales Analytics Dashboard
An interactive Power BI dashboard designed to analyze and monitor the performance of a coffee shop business. The dashboard provides a comprehensive overview of sales, profitability, customer activity, and revenue distribution across products, categories, cities, and time periods.
? Key Features:
Total Revenue, Total Profit, and Quantity Sold KPIs
Revenue analysis by product and category
Yearly revenue comparison
Revenue percentage by city
Profit margin analysis
Transaction trends across days
Interactive slicers (Year, City, Month) for dynamic filtering
? Business Value:
This dashboard enables data-driven decision-making by helping business owners:
Identify top-performing products
Track revenue trends over time
Analyze profitability margins
Understand city-level performance
Monitor transaction patterns