Coffee Shop Sales Dashboard
تفاصيل العمل
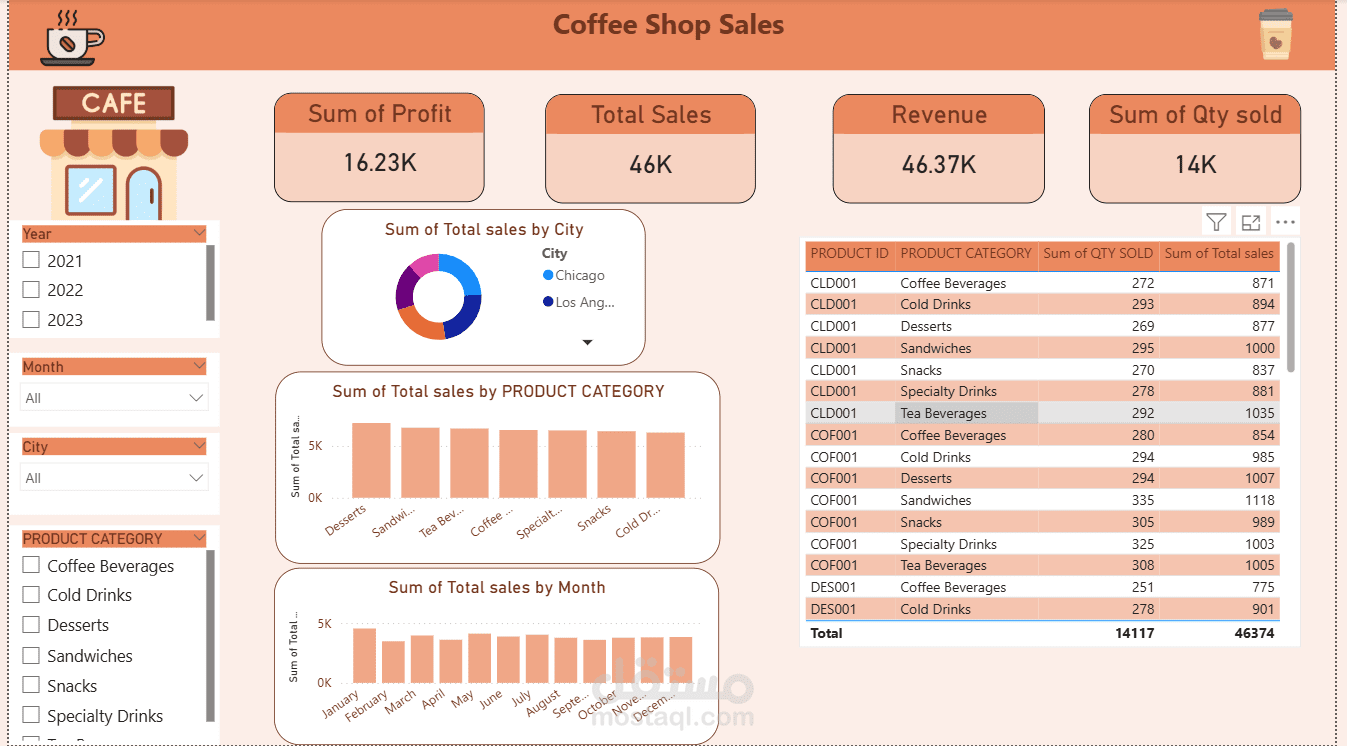
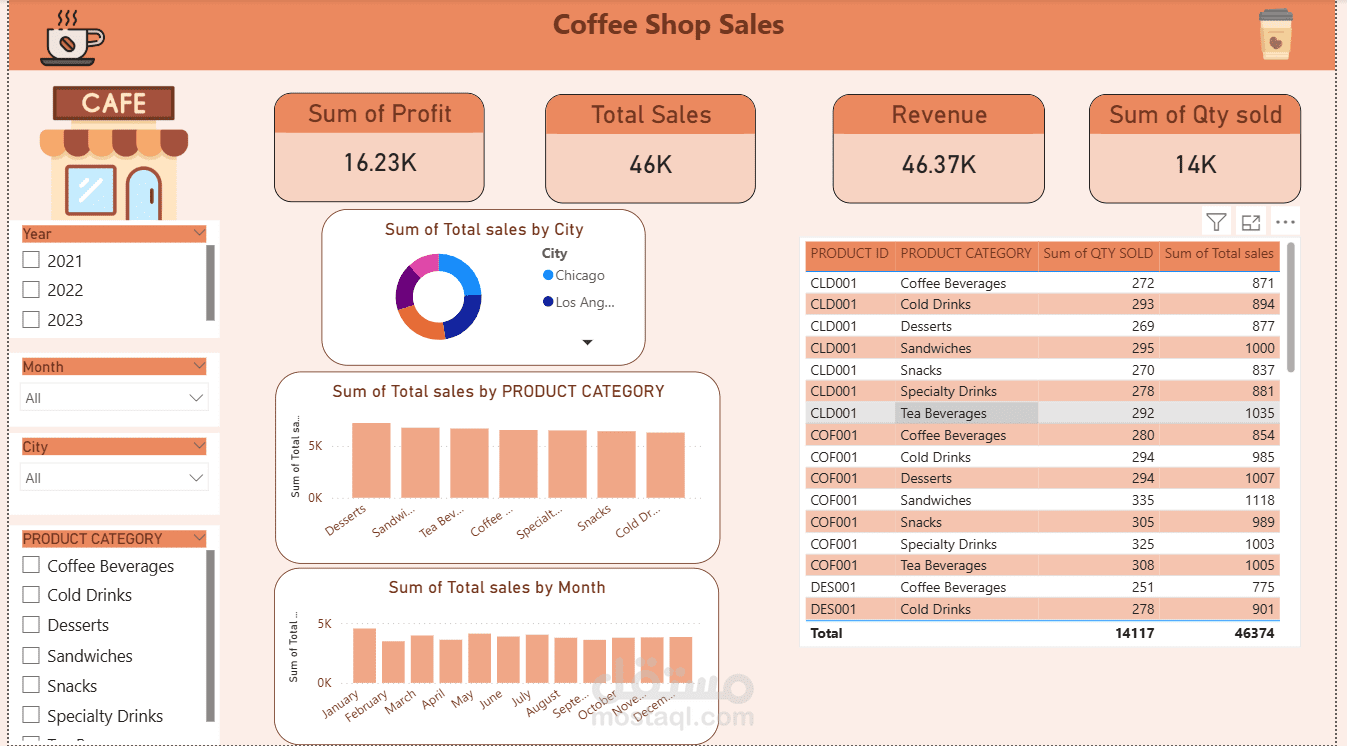
I built an interactive Coffee Shop Sales Dashboard using Power BI.
Cleaned and prepared the dataset for analysis.
Created key metrics such as Total Sales, Revenue, Profit, and Quantity Sold.
Designed interactive filters (Year, Month, City, and Product Category) to explore the data.
Built visualizations to analyze sales by city, product category, and month.
Created a detailed table to track product performance and sales quantities.
Designed a user-friendly and visually appealing dashboard layout for better insights.