STORE SALES ANALYS
تفاصيل العمل
مشروع Super Store Analysis هو حل تحليلي متكامل مصمم لتمكين المؤسسات من تحقيق أقصى قدر من الكفاءة التشغيلية والربحية في بيئة التجزئة. يركز المشروع على تقديم رؤية مزدوجة ومترابطة عبر نظام لوحات معلومات (Dashboards) متقدم:
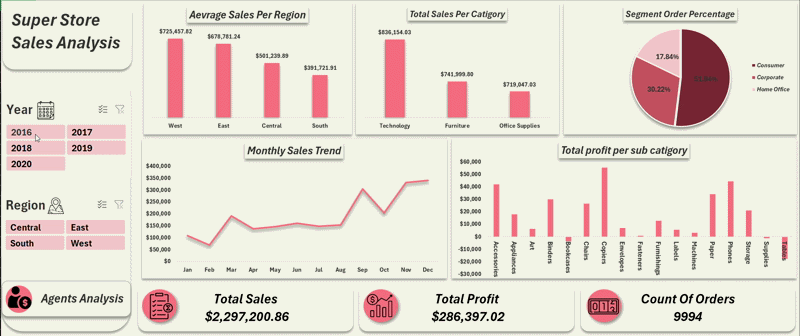
لوحة تحكم المبيعات (Sales Dashboard): توفر تحليلاً شاملاً ومفصلاً لأداء المبيعات في الوقت الفعلي. تتيح هذه اللوحة للإدارة مراقبة الإيرادات اليومية/الأسبوعية، وتحديد المنتجات الأكثر مبيعاً، وتحليل سلوك العملاء، وتتبع أداء المخزون، مما يدعم اتخاذ قرارات تسعير واستراتيجيات ترويجية سريعة ومستنيرة.
لوحة أداء الموظفين (Employee Performance Dashboard): تركز هذه اللوحة على الجانب البشري، حيث توفر تقييماً موضوعياً لأداء فريق العمل. تتيح الإدارة تحديد نقاط القوة والضعف في أداء الموظفين، ومراقبة كفاءة المهام، وتحديد مجالات التدريب والتطوير اللازمة لرفع مستوى الإنتاجية والرضا الوظيفي.
الهدف: يهدف هذا النظام إلى ربط الأداء المالي (المبيعات) بالأداء البشري (الموظفين)، مما يسمح للإدارة بتحسين العمليات التشغيلية، وزيادة المبيعات، وضمان بيئة عمل فعالة ومحفزة.