Cars Store Sales Analysis
تفاصيل العمل
مشروع End-to-End Sales Analysis هو مبادرة متكامل لتحويل البيانات الخام غير المنظمة للمبيانات المبيانات المبيعات إلى نموذج بيانات منظم وهيكلية تفاعلية (Structured Data Model) ولوحة تحكم (Dashboard) ذكية تقدم رؤى تجارية (Business Insights) حاسمة لاتخاذ القرارات الاستراتيجية.
نظرة عامة: يهدف المشروع إلى تحليل أداء مبيعات متجر السيارات من خلال مراحلها الكاملة: التنظيف، الهيكلة، والنمذجة، وصولاً إلى بناء لوحة تحكم تفاعلية. الهدف النهائي هو إنشاء مسار بيانات موثوق (Reliable Pipeline) يربط بين قاعدة البيانات الخام (Raw Database) وحلحلول التقار (Reporting Solutions) التفاعلية الكاملة.
الأدوات والتقنيات المستخدمة:
SQL: لتنظيف البيانات (Cleaning)، التسوية (Normalization)، وتوليد مُعرف فريد (ID Generation) لضمان سلامة البيانات.
ODBC: للاتصال بقاعدة البيانات (Database Connection) مع Excel.
Power Query: لاستخدام استعلامات متقدمة (Advanced Queries) باستخدام عبارات CTE (Common Table Expressions) لاستخراج مجموعات البيانات المطلوبة.
Excel Power Pivot: لبناء النماذج العلائقي (Relational Model)، وبناء المقاييس (Measures) والحقول المحسوبة (Calculated Fields).
Excel Dashboard: لتصور البيانات التفاعلية (Data Visualization)، وإضافة مؤشرات الأداء الرئيسية (KPIs)، وتفعيل خاصية التصفية (Filtering) والتحليل الديناميكي.
العملية العمل (Workflow):
تنظيف وهيكلة البيانات (SQL): معالتعامل مع السجلات المتسقة والمتكررة (Inconsistent and Duplicate Records)، وتوحويل البيانات الخام إلى جداول منظمة (Structured Tables) مع توليد مُعرف فريد لضمان سلامة البيانات.
الاستير (ODBC Connection): الاتصال بقاعدة البيانات باستخدام ODBC واستير الجداول المنظمة مباشرة إلى Excel.
التحويل البيانات (Power Query): استخدام استعلامات CTE المتقدم (Advanced CTEs) لاستخراج مجموعات البيانات المطلوبة فقط، وتحسين أداء الاستعلامات.
النمذجة (Pivot): بناء العلاقات بين الجداول (Fact and Dimension Tables)، وبناء نموذج علقي منظم، وتصميم المقاييس والحقول والحقول المحسوبة.
تطوير لوحة التحكم (Dashboard Development): تطوير لوحة تحكم تفلية تتيح التصفية (Filtering) والتحليلاميكي، وإضافة مؤشرات الأداء الرئيسية (KPIs).
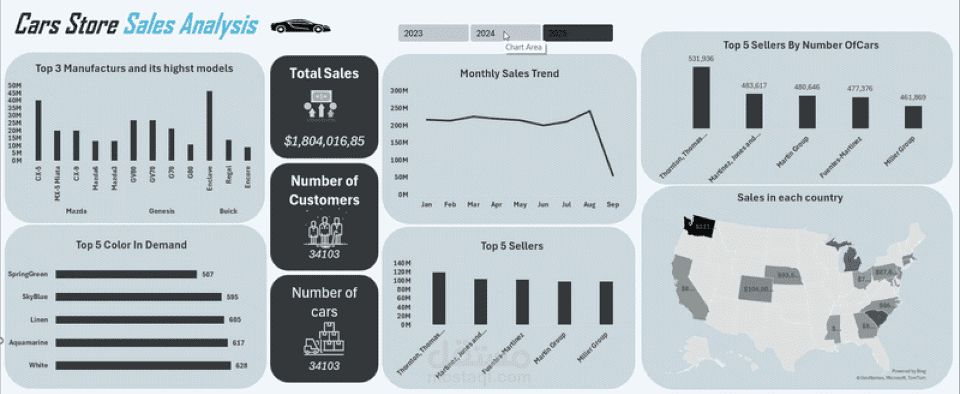
الرؤى الرئيسية التي تم تقديمها (Key Insights Delivered):
اتجاهات الأداء (Performance Trends).
أفضل نماذج السيارات (Top-Performing Car Models).
تحليل الإيرادات (Revenue Breakdown Analysis).
أنماط شراء العملاء (Customer Purchase Patterns).
مقارنة الأداء المناطق (Regional Performance Comparison).
النتيجة المشروع (Project Outcome): يُظهر هذا المشروع:
مهارة قوية في إعداد البيانات (Data Preparation Skills) باستخدام SQL.
فهم عميق للنمذات العلائقية للبيانات (Relational Data Modeling).
القدرة على ربط قواعد البيانات ببرامج مثل Excel.
إتقنية متقدمة في التقارير باستخدام Power Pivot.
إتقنية شاملة لسير عمل (End-to-end Business Intelligence Workflow).