data cleaning a extracting actual insights
تفاصيل العمل
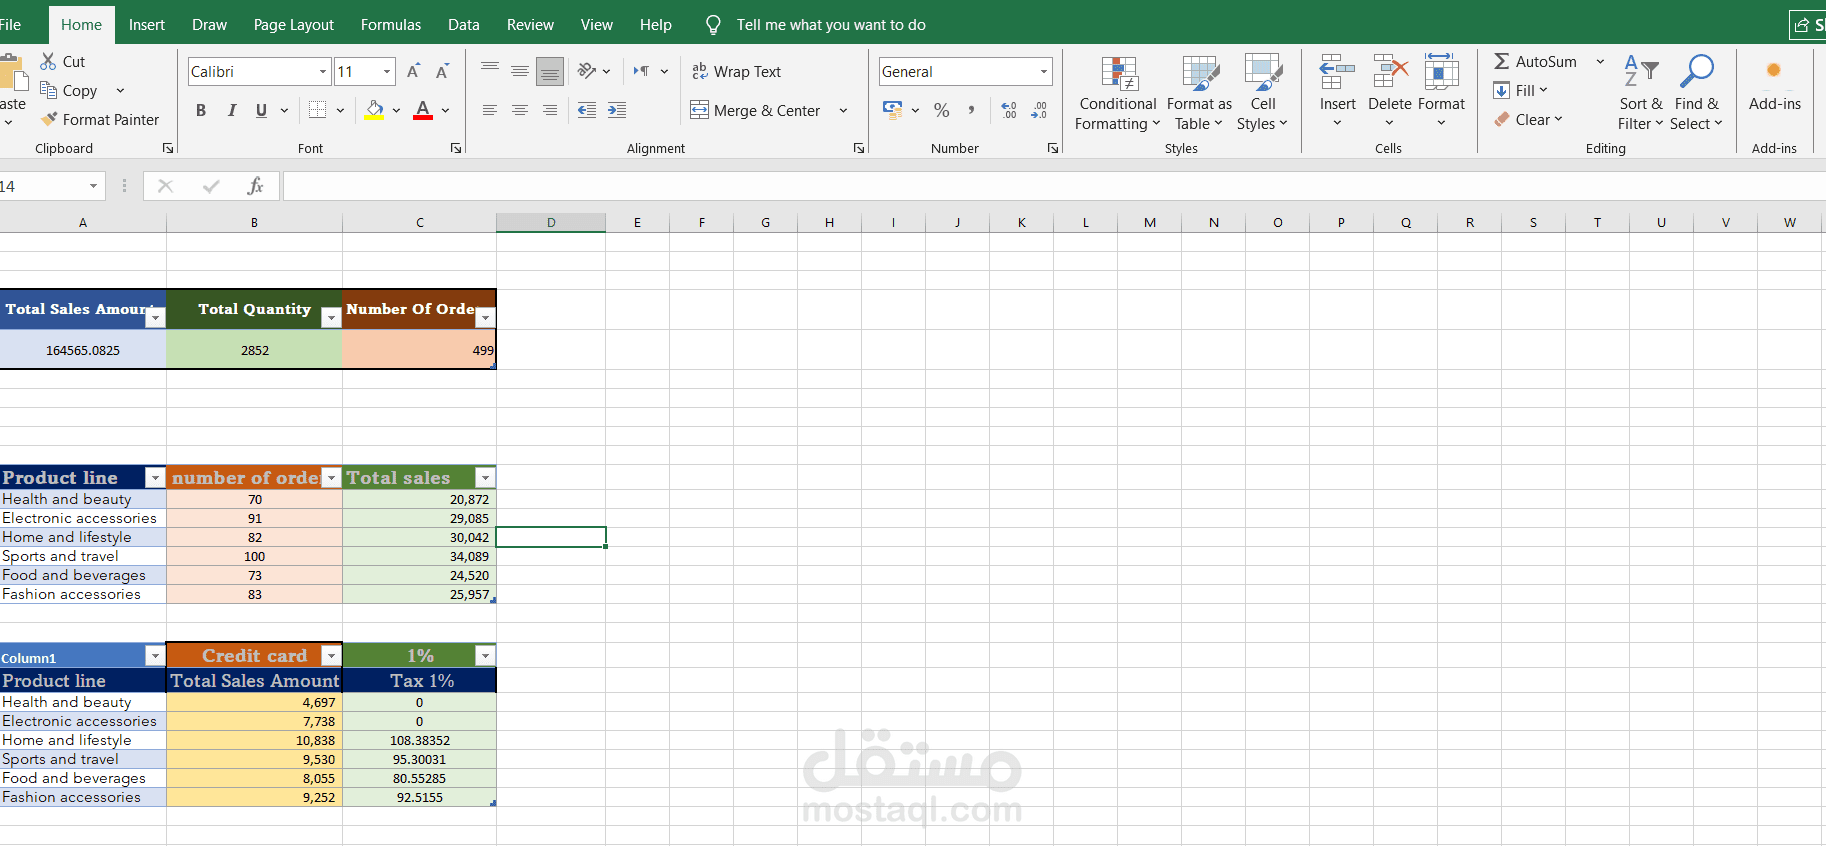
Performed comprehensive sales analysis using Microsoft Excel to calculate key business metrics and evaluate overall sales performance. Cleaned and organized raw sales data by removing duplicates, correcting inconsistencies, and ensuring data accuracy.
Used Excel tools such as Pivot Tables, Pivot Charts, formulas, and functions (SUM, IF, VLOOKUP, XLOOKUP, COUNTIFS) to calculate total sales, revenue trends, product performance, and regional sales distribution. Applied sorting, filtering, and conditional formatting to highlight top-performing products and identify sales patterns.
Created interactive dashboards and visual reports to present insights clearly, helping stakeholders understand performance trends, identify growth opportunities, and support data-driven business decisions.
Tools Used: Microsoft Excel, Pivot Tables, Pivot Charts, Formulas & Functions, Conditional Formatting, Data Cleaning, Data Analysis, Dashboard Creation