Returned Products Analysis With Power BI
تفاصيل العمل
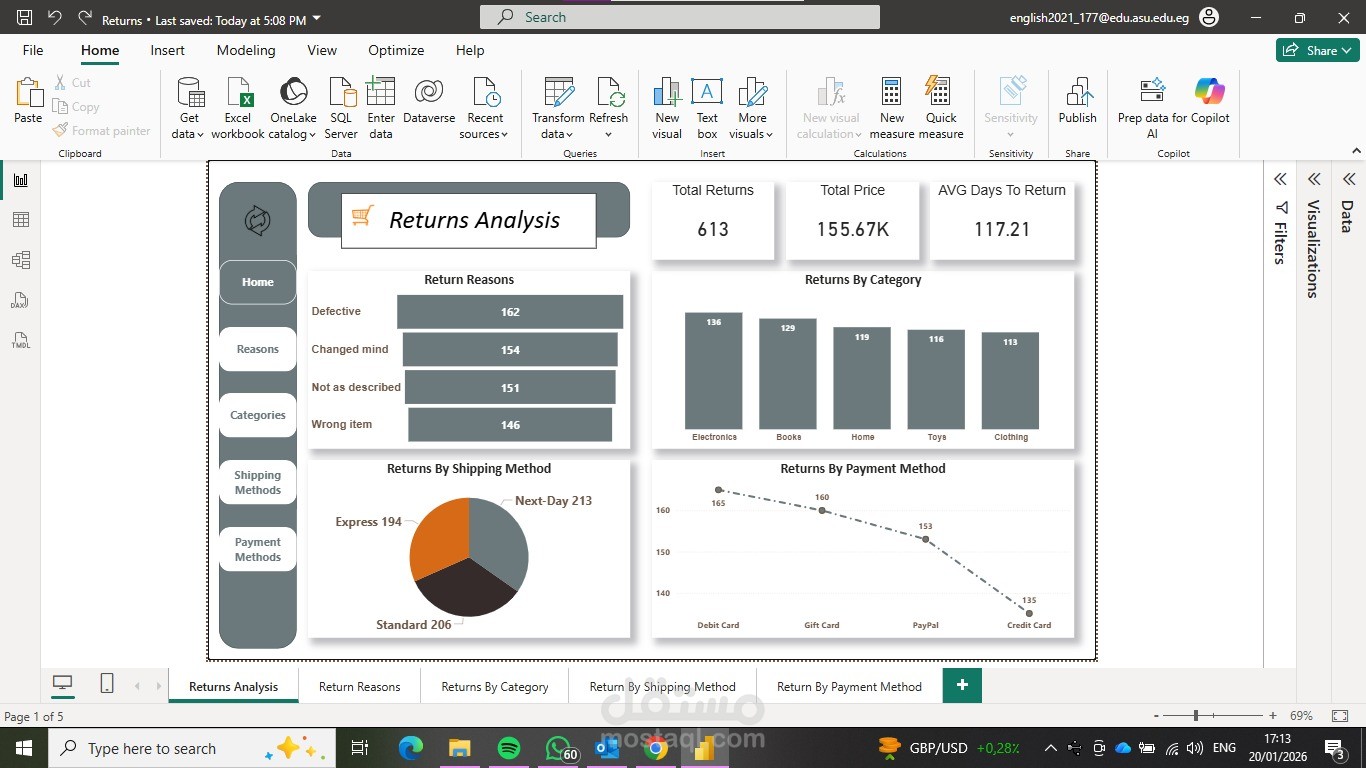
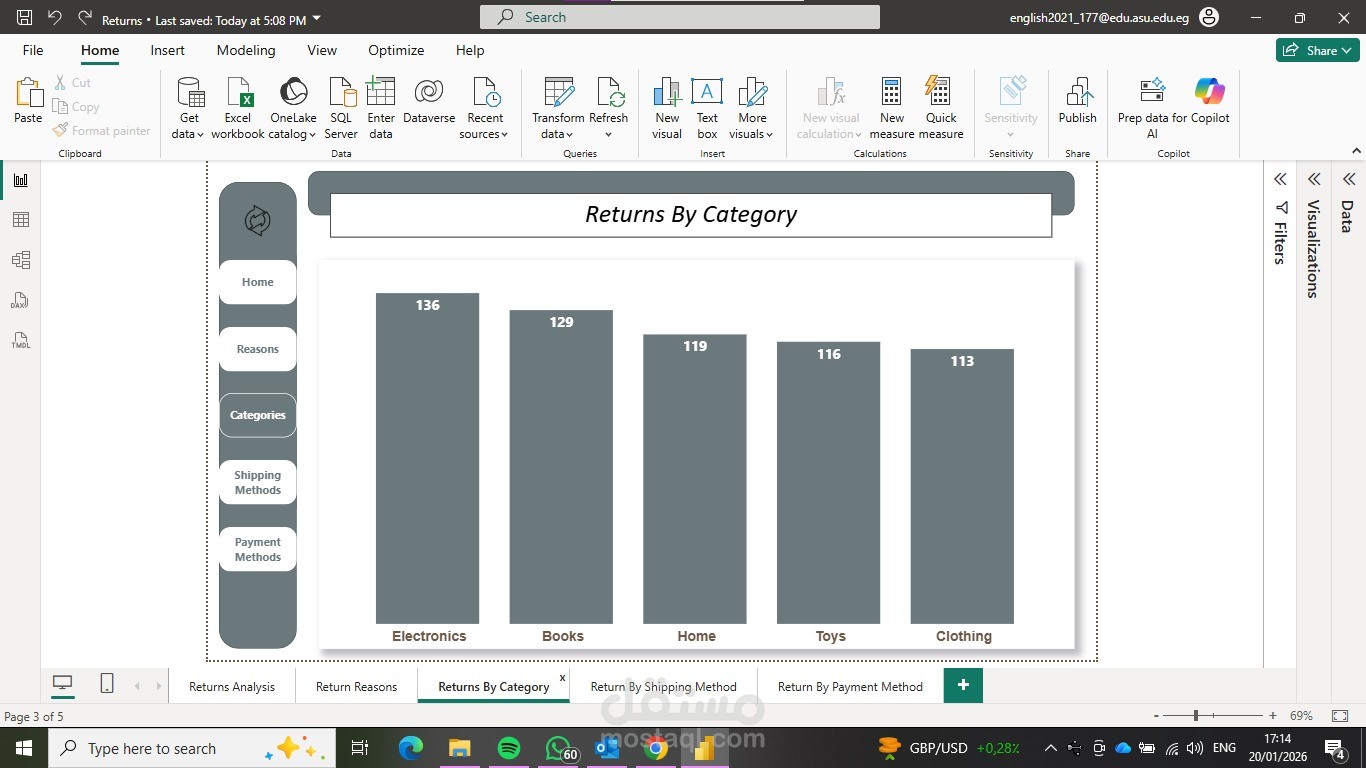
Power BI dashboard analyzing product returns to understand financial impact and customer behavior.
It tracks total returns, return costs, and average time to report issues.
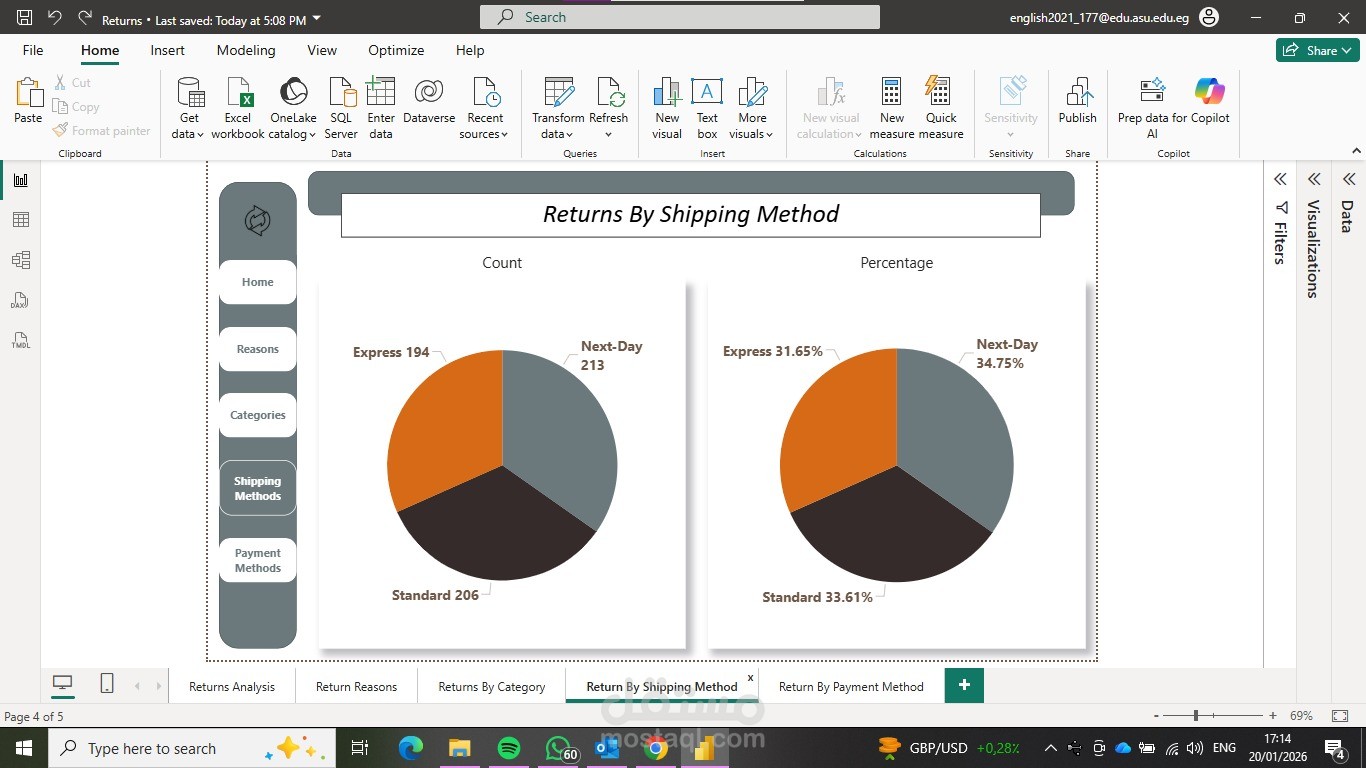
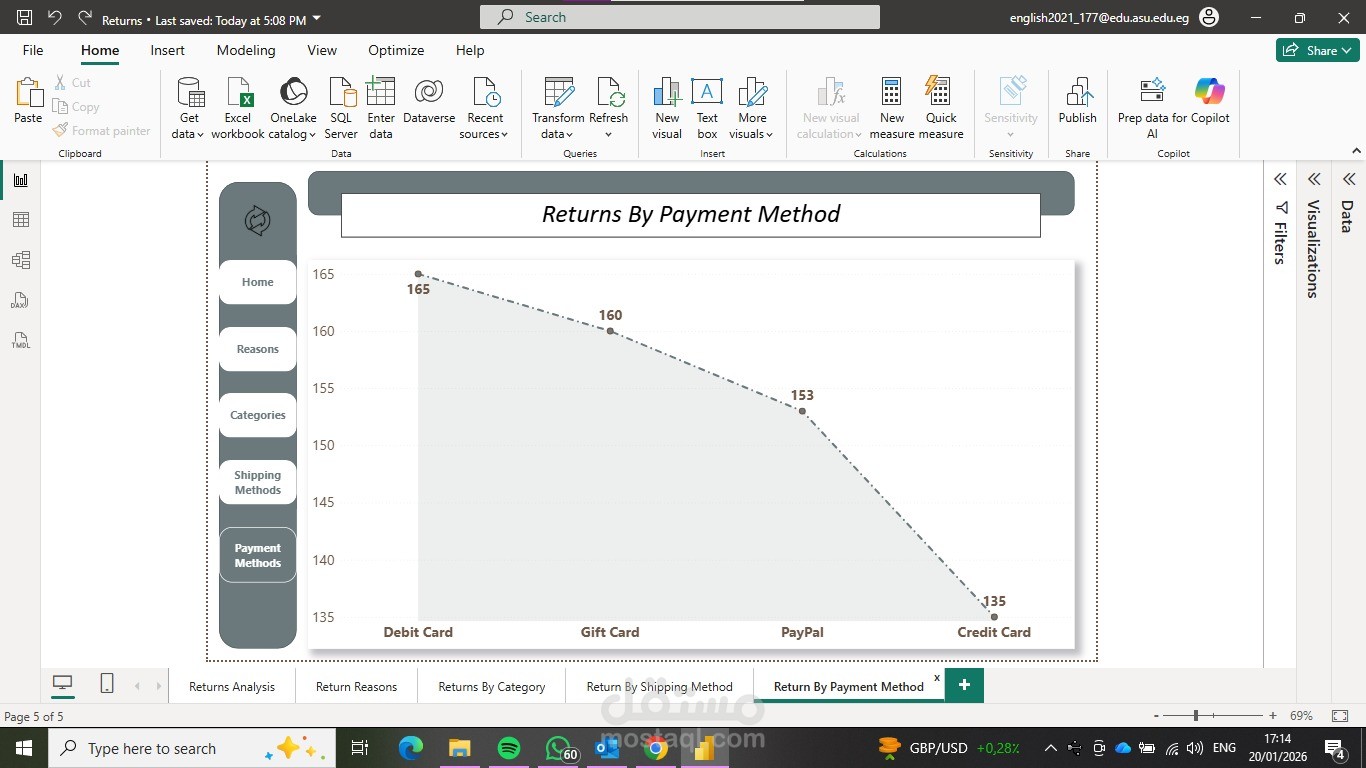
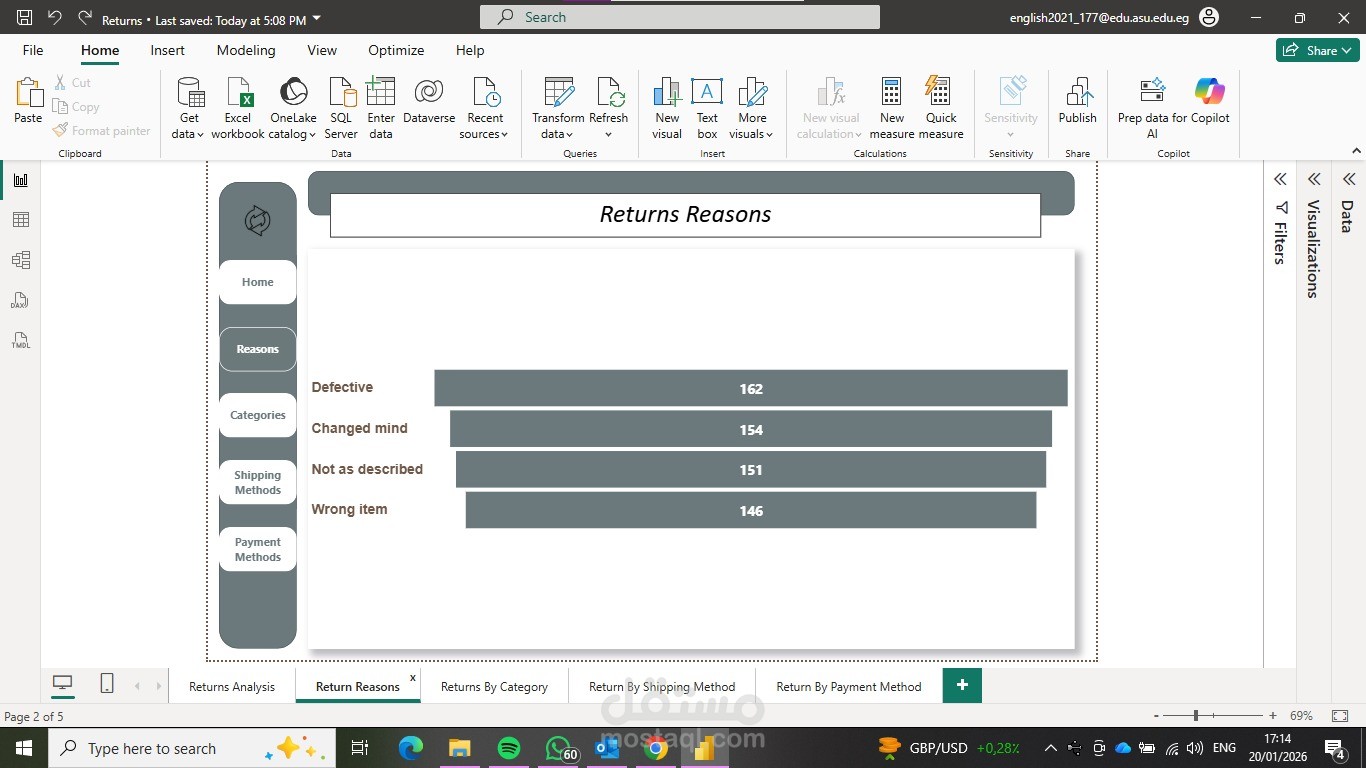
The dashboard highlights top return categories, groups similar return reasons for clarity, and shows payment and shipping methods with higher return rates.
Built with Power Query and data modeling, it provides actionable insights to reduce losses and improve operations.