coca-cola dashboard
تفاصيل العمل

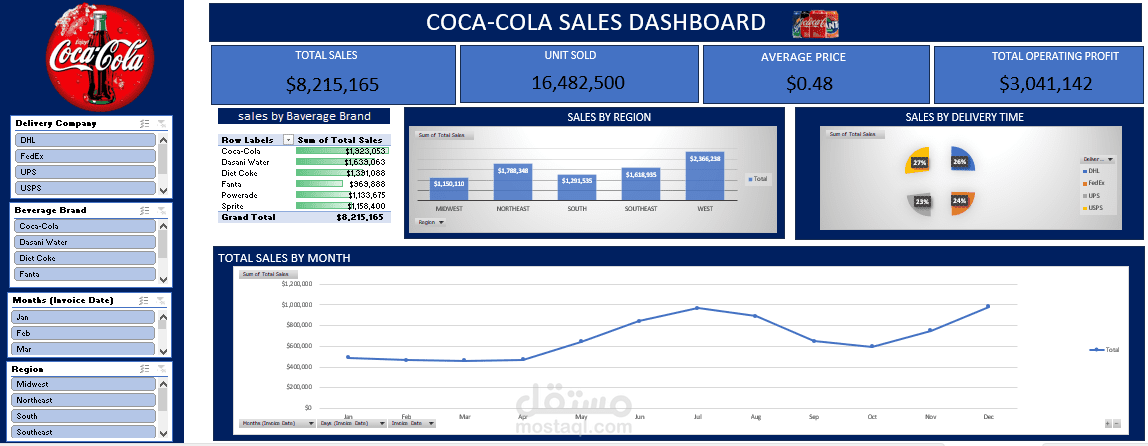
This is a data analysis project I worked on using Excel. The project uses a simulated dataset to practice analyzing sales and operational data – the data is not real.
In this project, I cleaned and organized the dataset, then created Pivot Tables and charts to explore key metrics such as total sales, units sold, and customer activity.
I analyzed data by product, region, and time to identify trends and patterns. I also built an interactive dashboard using slicers and filters so the results can be easily explored and understood.
This project helped me improve my skills in Excel, data cleaning, data analysis, and dashboard design, while turning raw data into clear insights.