orascom operations dashboard-data analysis project
تفاصيل العمل

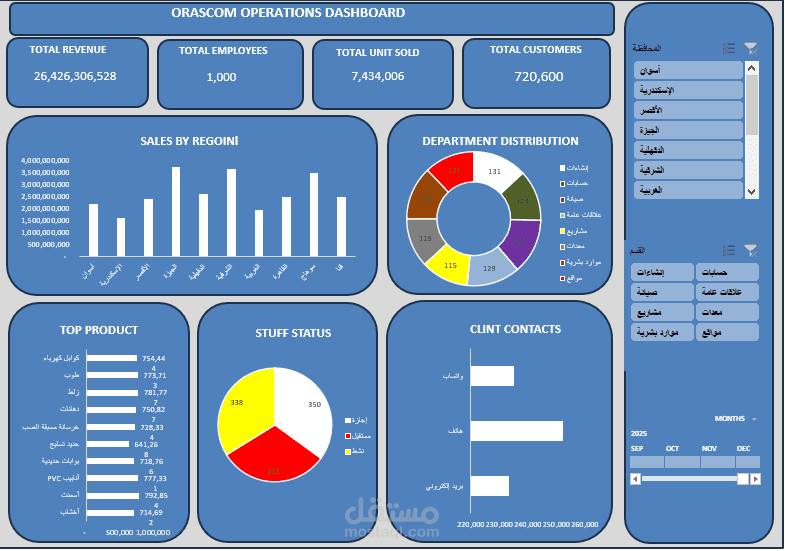
This is a project I did for practice, using a simulated dataset – the data is not real. I created it to practice data analysis and dashboard design.
In this project, I analyzed operational data and built an interactive dashboard in Excel to help understand performance and trends.
I worked on:
Cleaning and organizing the data
Calculating key metrics like total revenue, total employees, total units sold, and total customers
Analyzing sales by region and department
Identifying top products and staff status
Tracking client contacts and monthly performance
I designed the dashboard to be interactive using slicers and filters, so anyone can easily explore the data by region, department, or month.
This project helped me improve my skills in Excel, data analysis, and creating professional dashboards.