Sales Dashboard – Excel
تفاصيل العمل
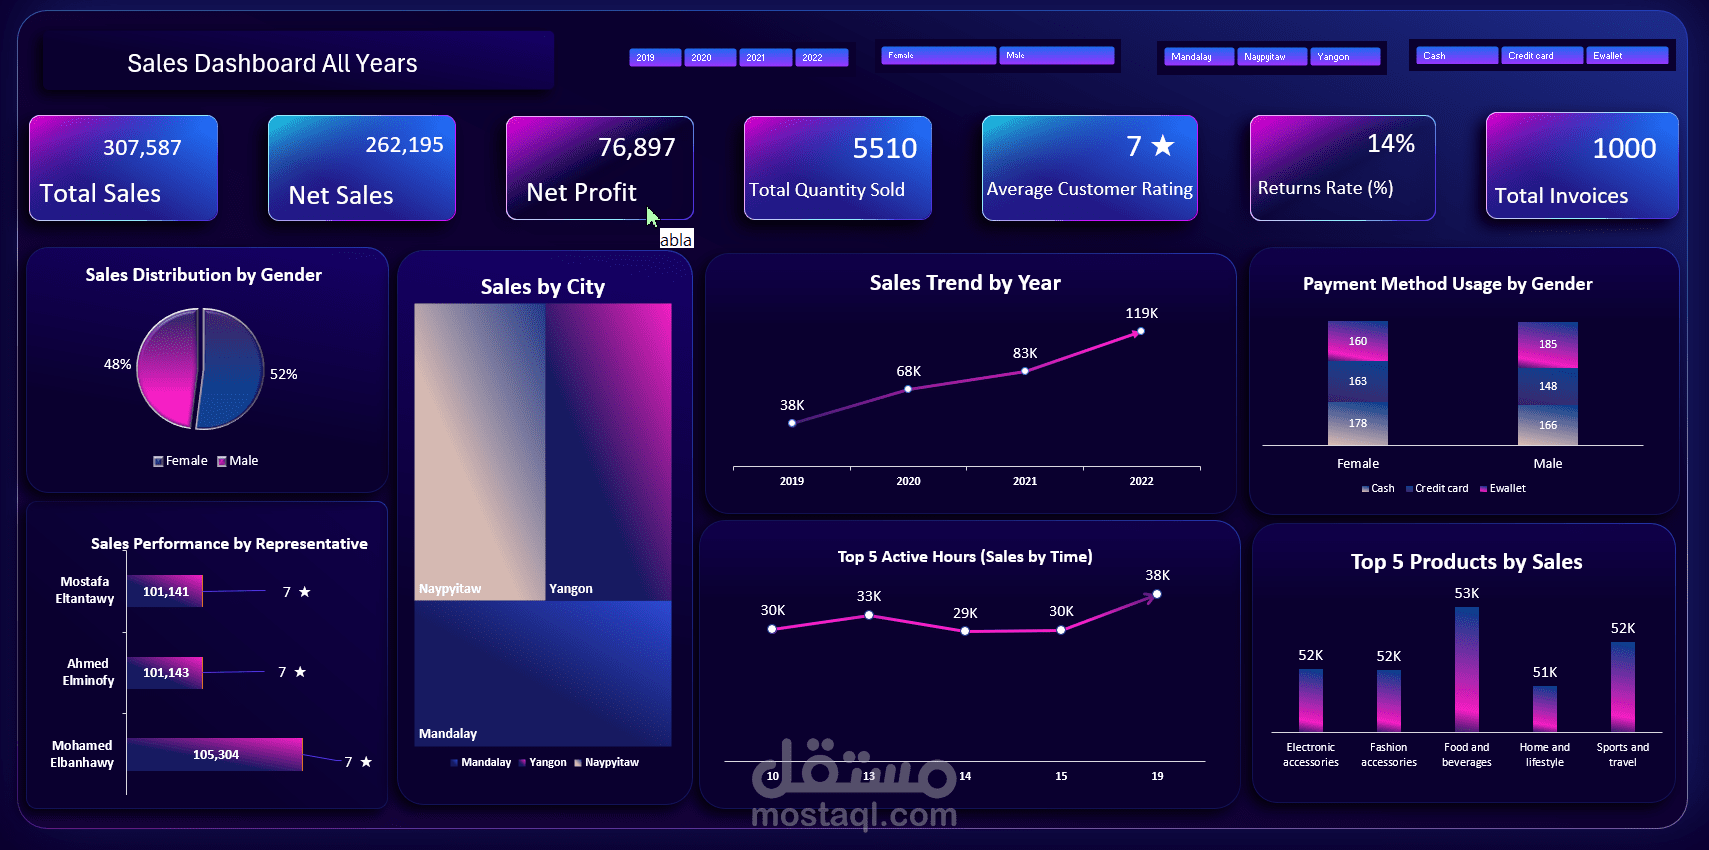
Sales Dashboard – Excel Project
I’m excited to share a new interactive Sales Dashboard I designed using Excel.
This project focused on transforming raw sales data into a clear, visual, and meaningful snapshot that supports better decision-making.
✨ Key Highlights of the Dashboard:
• Comprehensive KPIs: Total Sales, Net Sales, Net Profit, Quantity Sold, Customer Rating, Returns Rate, Total Invoices
• Sales Trend Analysis (2019–2022)
• Gender-based Sales Distribution
• Sales Comparison Across Cities
• Payment Method Usage by Gender
• Performance Evaluation of Sales Representatives
• Top Active Sales Hours
• Top 5 Best-Selling Product Categories
Tools & Techniques:
hashtag#Excel hashtag#PivotTables hashtag#PivotCharts hashtag#DataModeling hashtag#DataCleaning hashtag#DashboardDesign