لوحة تحليلات الموارد البشرية
تفاصيل العمل
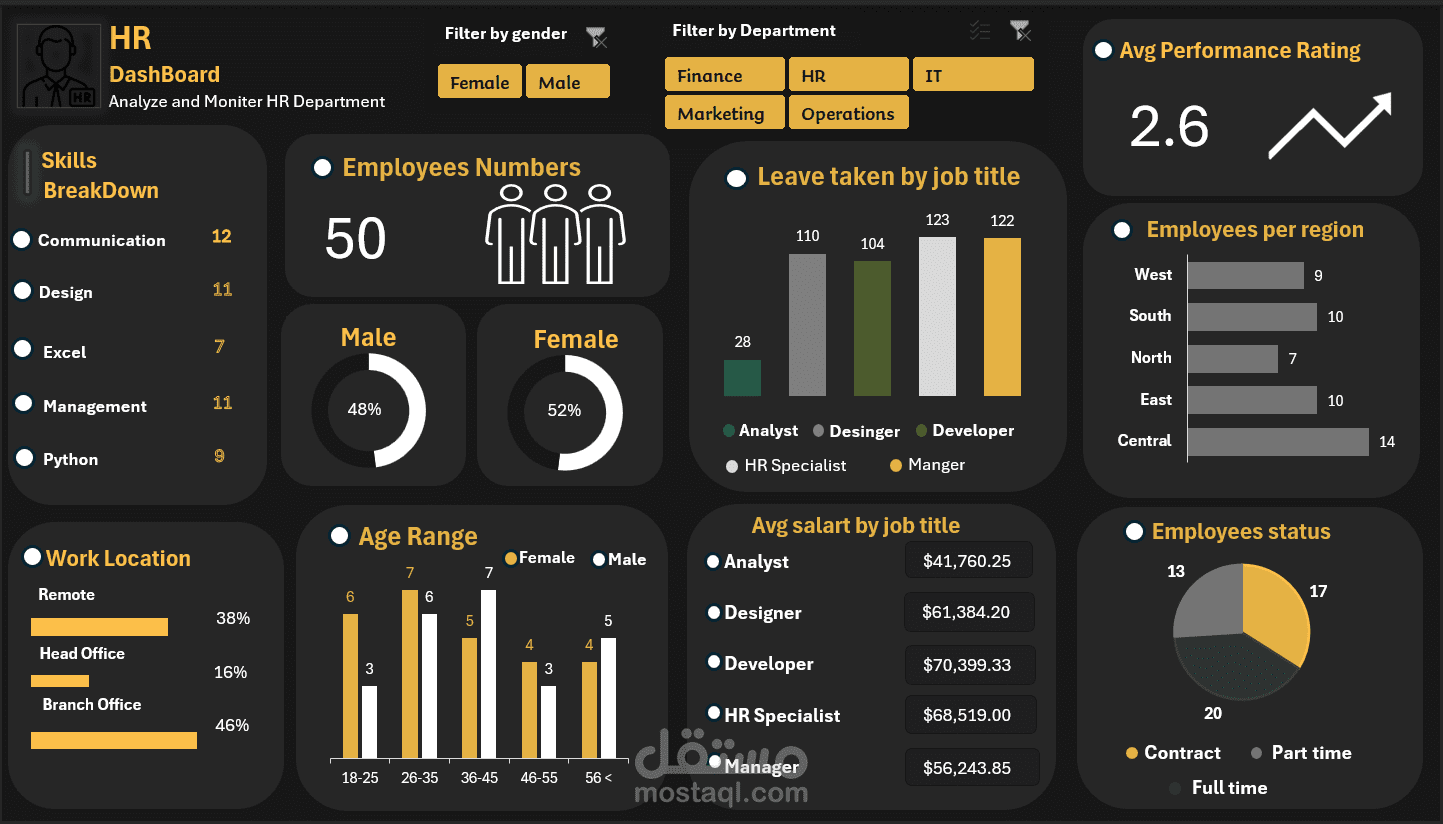
يهدف المشروع إلى فهم خصائص الموظفين داخل الشركة مثل التوزيع الديموغرافي، الأداء الوظيفي، نوع التوظيف، والإجازات، وذلك للمساعدة في:
تحسين تخطيط الموارد البشرية
دعم قرارات التوظيف والترقية
تقليل معدل الغياب وتحسين الإنتاجية
تحقيق توزيع أفضل للموظفين على الأقسام
محاور التحليل التي تم تنفيذها
تحليل التوزيع حسب النوع (Gender Distribution)
تم تحليل نسبة الذكور والإناث داخل المؤسسة لمعرفة مدى التوازن في بيئة العمل، وهو مؤشر مهم لسياسات التنوع الوظيفي.
تحليل توزيع الموظفين على الأقسام (Department Analysis)
تم دراسة عدد الموظفين في كل قسم مثل:
المالية
الموارد البشرية
تقنية المعلومات
التسويق
العمليات
ويساعد هذا المشروع على معرفة الأقسام التي تحتاج إلى دعم أو إعادة هيكلة.
? تحليل الفئات العمرية (Age Groups Analysis)
تم تقسيم الموظفين إلى فئات عمرية مختلفة بهدف:
فهم طبيعة القوى العاملة
تحديد احتياجات التدريب
التنبؤ بمعدلات التقاعد أو الاستقالة
تحليل تقييم الأداء (Performance Rating Analysis)
تم حساب متوسط تقييم الأداء العام للموظفين، وهو مؤشر مهم لقياس مستوى الإنتاجية والكفاءة داخل المؤسسة.
تحليل نوع التوظيف (Employment Type)
تم تحليل توزيع الموظفين حسب نوع العقد مثل:
دوام كامل
دوام جزئي
تعاقد
وذلك لفهم مدى اعتماد الشركة على كل نوع من أنواع التوظيف.
تحليل الإجازات (Leave Analysis)
تم حساب مجموع الإجازات التي يحصل عليها الموظفون في كل وظيفة، مما يساعد في:
قياس ضغط العمل
اكتشاف احتمالية الاحتراق الوظيفي
تحسين سياسات الإجازات
تحليل المهارات الوظيفية (Skills Distribution)
تم تحليل توزيع المهارات داخل المؤسسة مثل:
التواصل
التصميم
التحليل
التطوير
الأدوات المستخدمة
Excel
Pivot Tables
Data Cleaning(power query)
Data Visualization