Interactive Excel Dashboard for Global Sports Footwear Sales
تفاصيل العمل

Project Description:
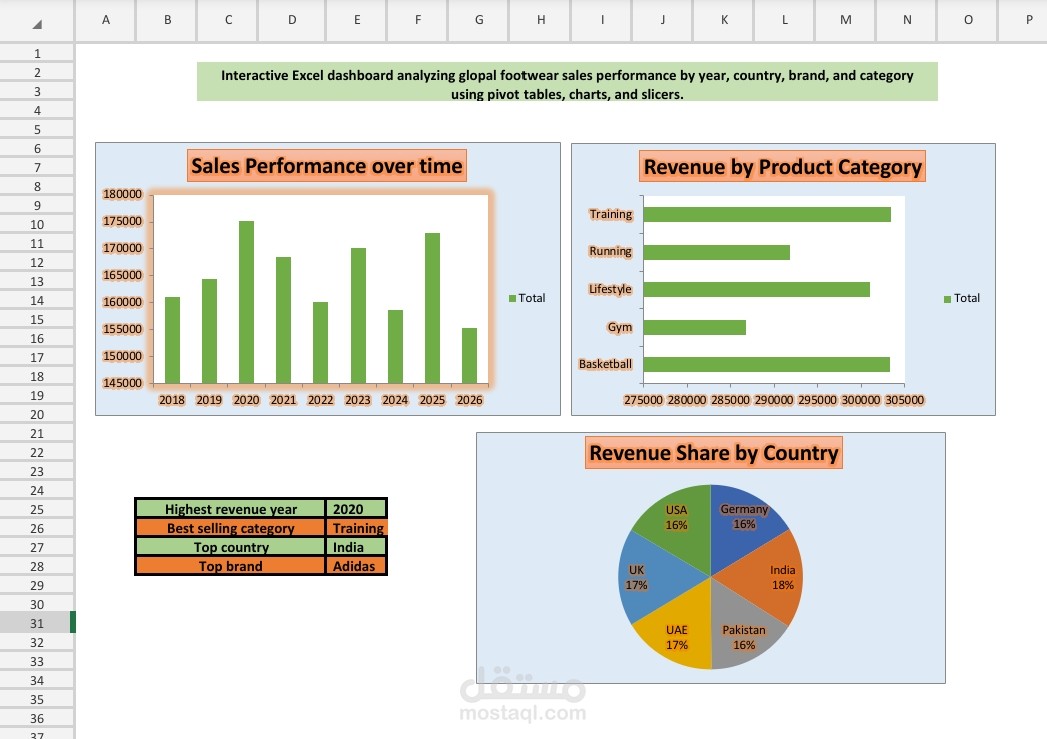
This project presents an interactive Excel dashboard analyzing global sports footwear sales data.
The dashboard provides insights into:
Total sales performance across years
Best-selling product categories and brands
Top-performing countries by revenue
Highest revenue year
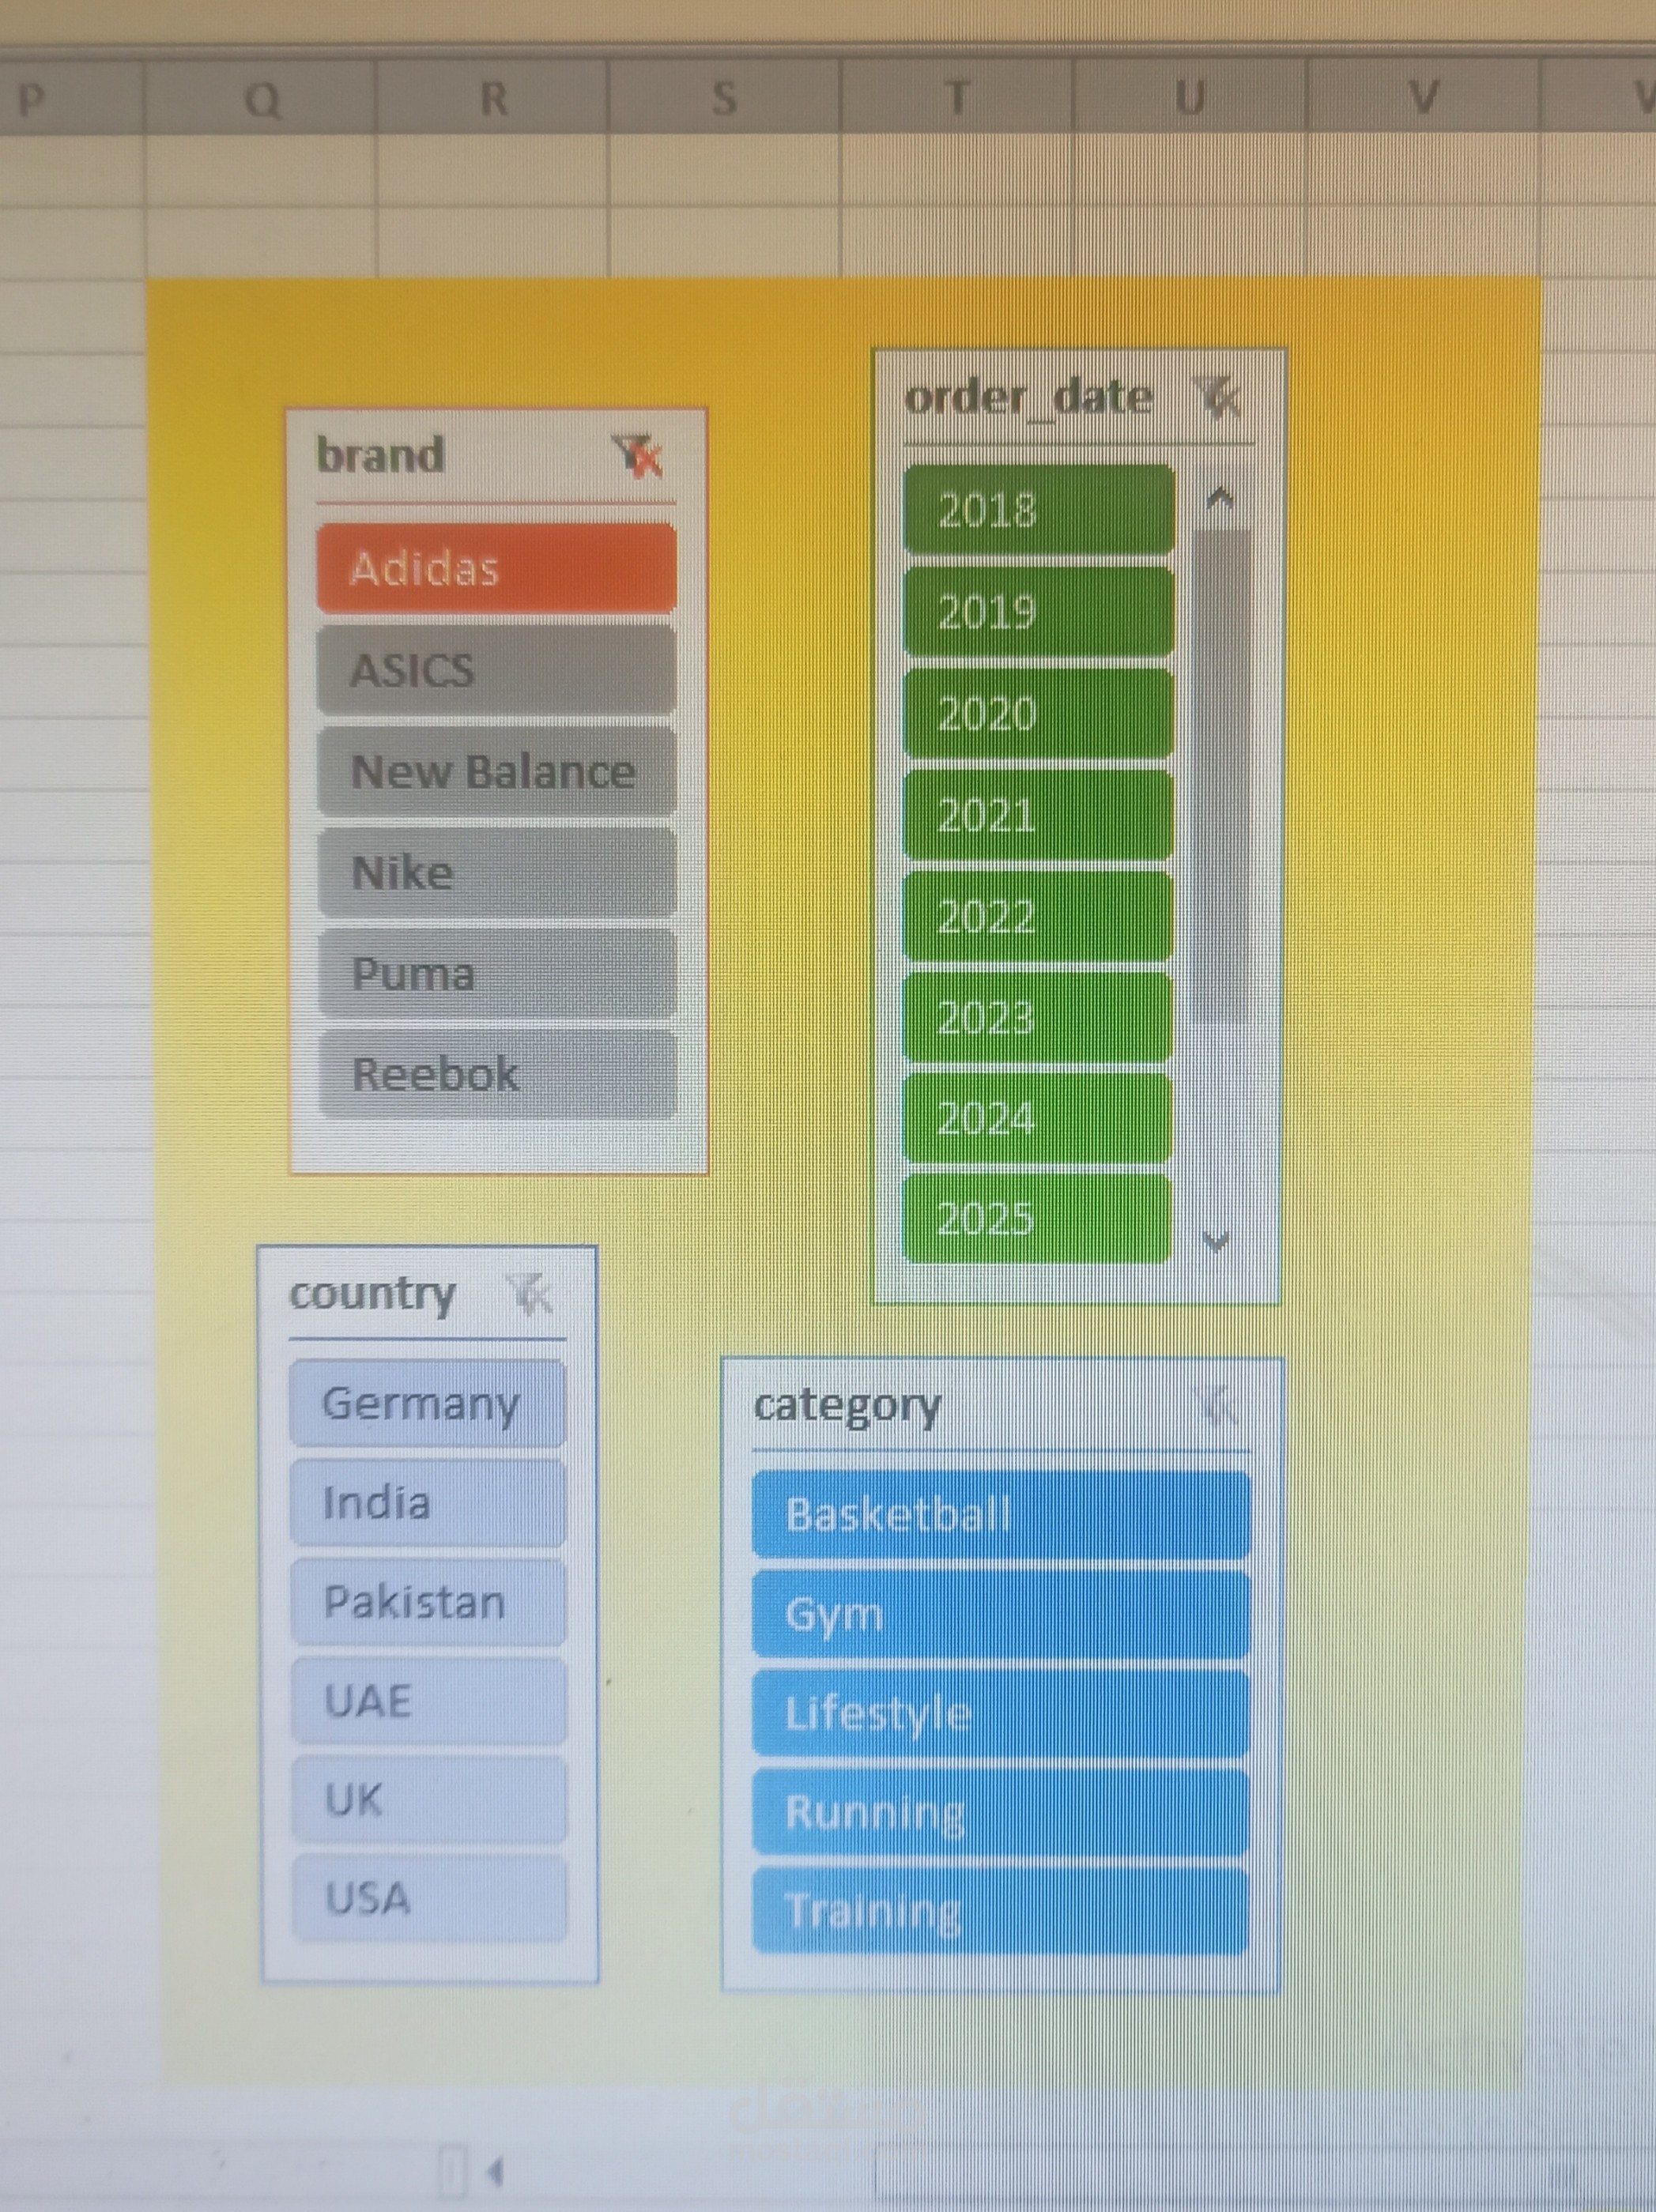
The dashboard uses Pivot Tables, Pivot Charts, and Slicers to allow dynamic filtering and easy data exploration for business decision-making.