Sales Performance Analysis With Excel
تفاصيل العمل
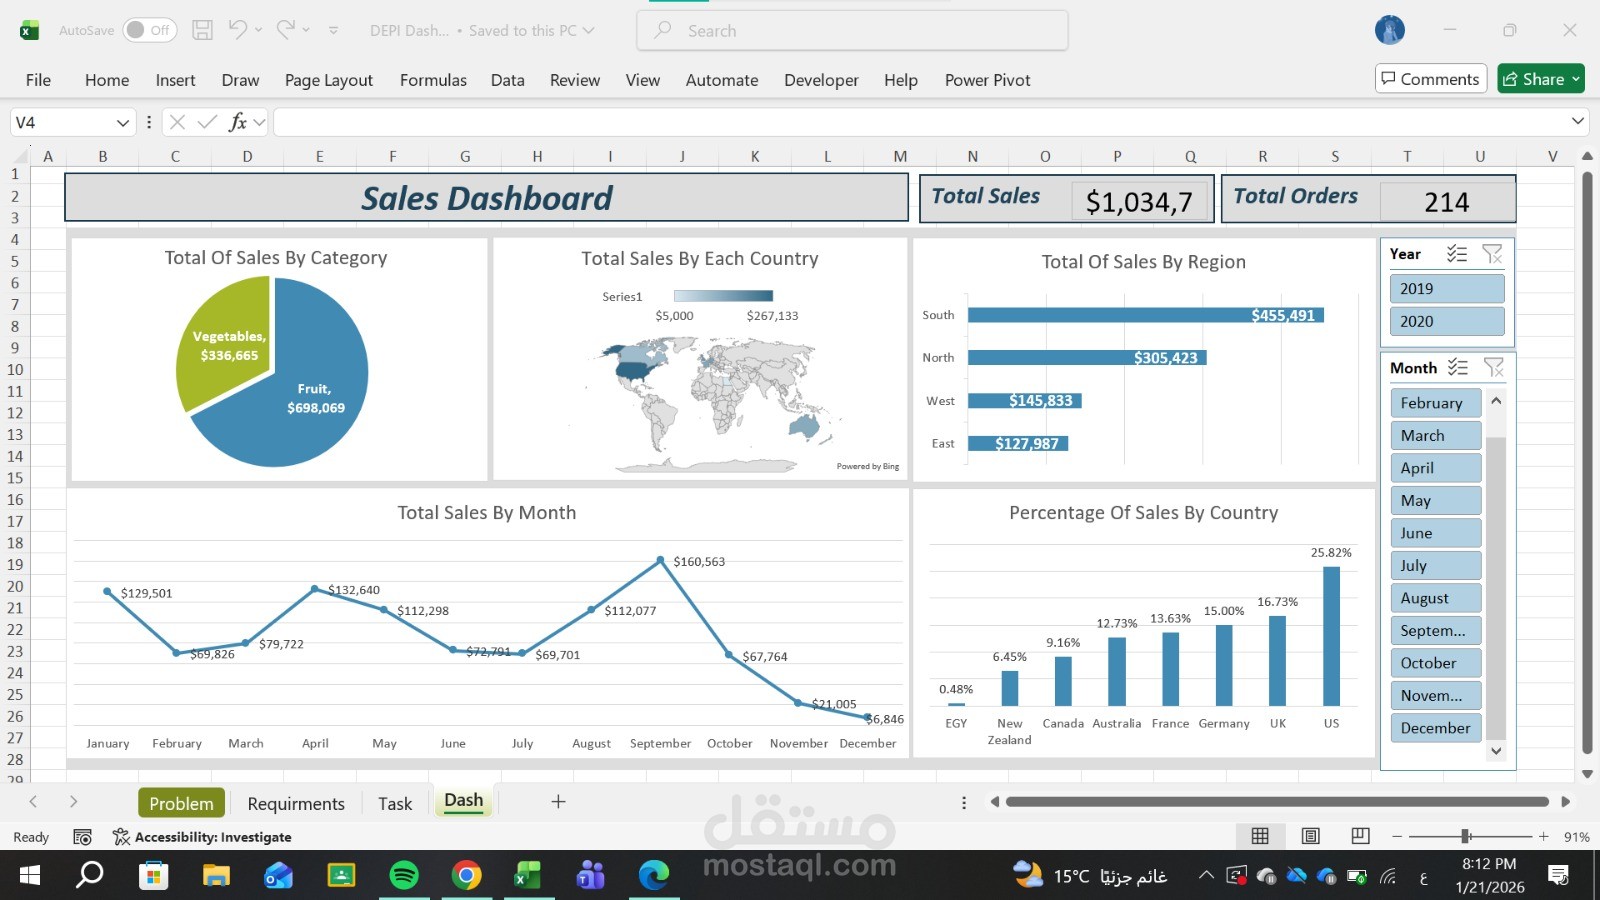
This Excel dashboard analyzes sales of Fruit & Vegetables across regions and countries, providing actionable insights for better decision-making.
It tracks total sales, number of orders, and average sales per country, with detailed breakdowns by region and product category.
The dashboard also shows sales trends over months and years (2019–2020) using interactive slicers.
Built with clean data, Pivot Tables, Pivot Charts, and an interactive layout to highlight key metrics alongside detailed insights.