Data Visualization Using Python (Seaborn & Matplotlib)
تفاصيل العمل

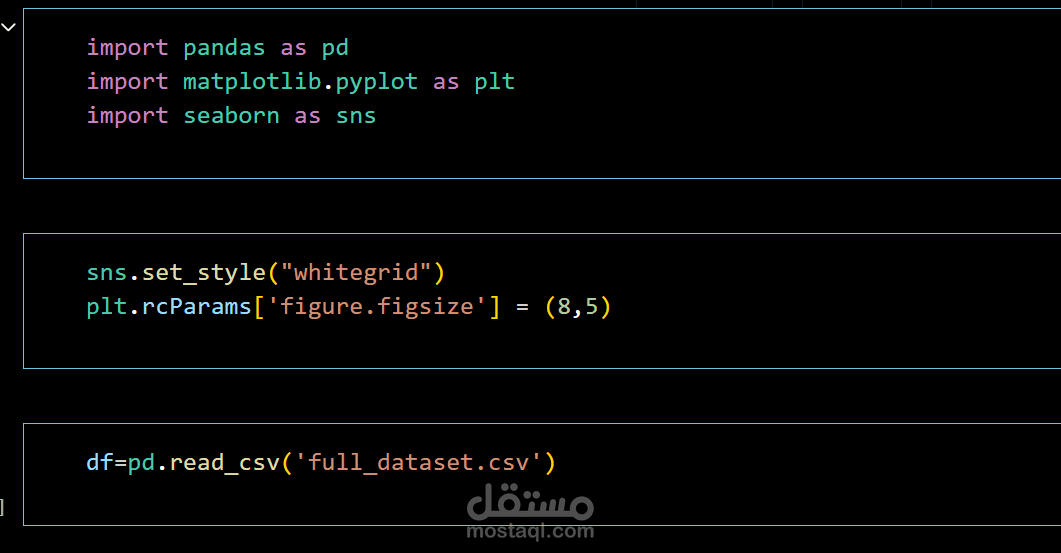
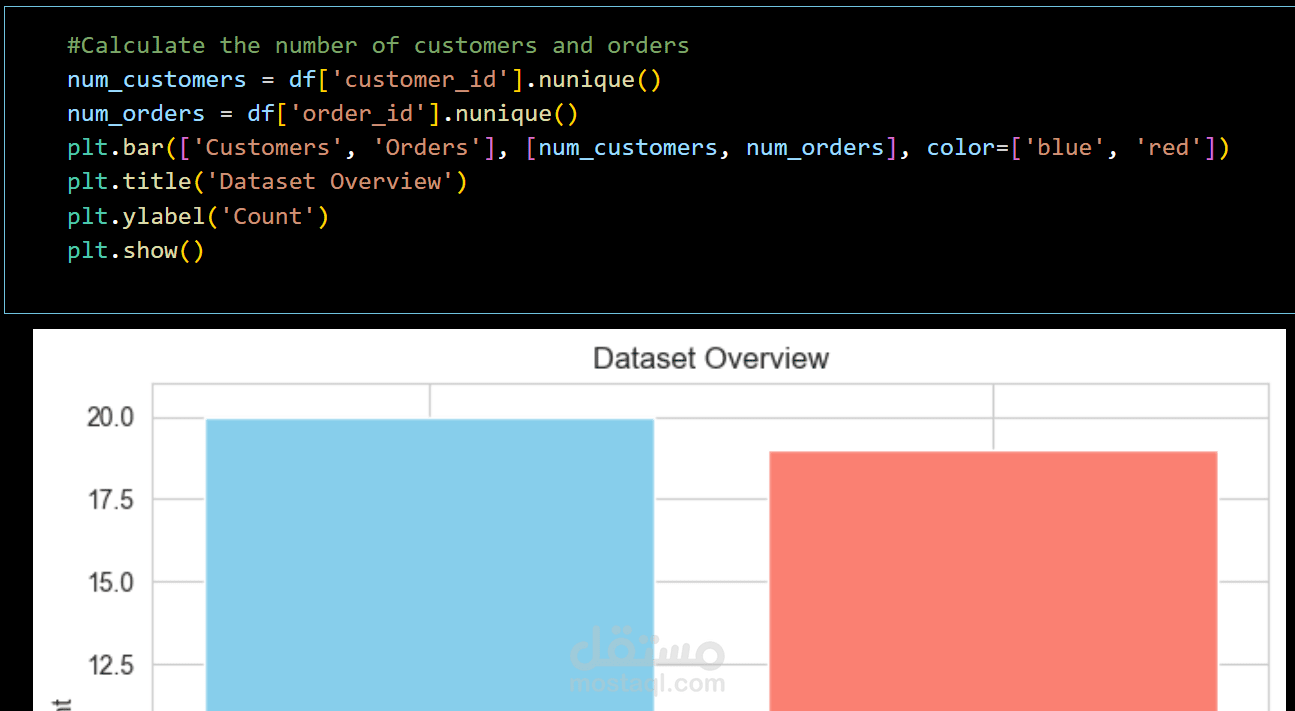
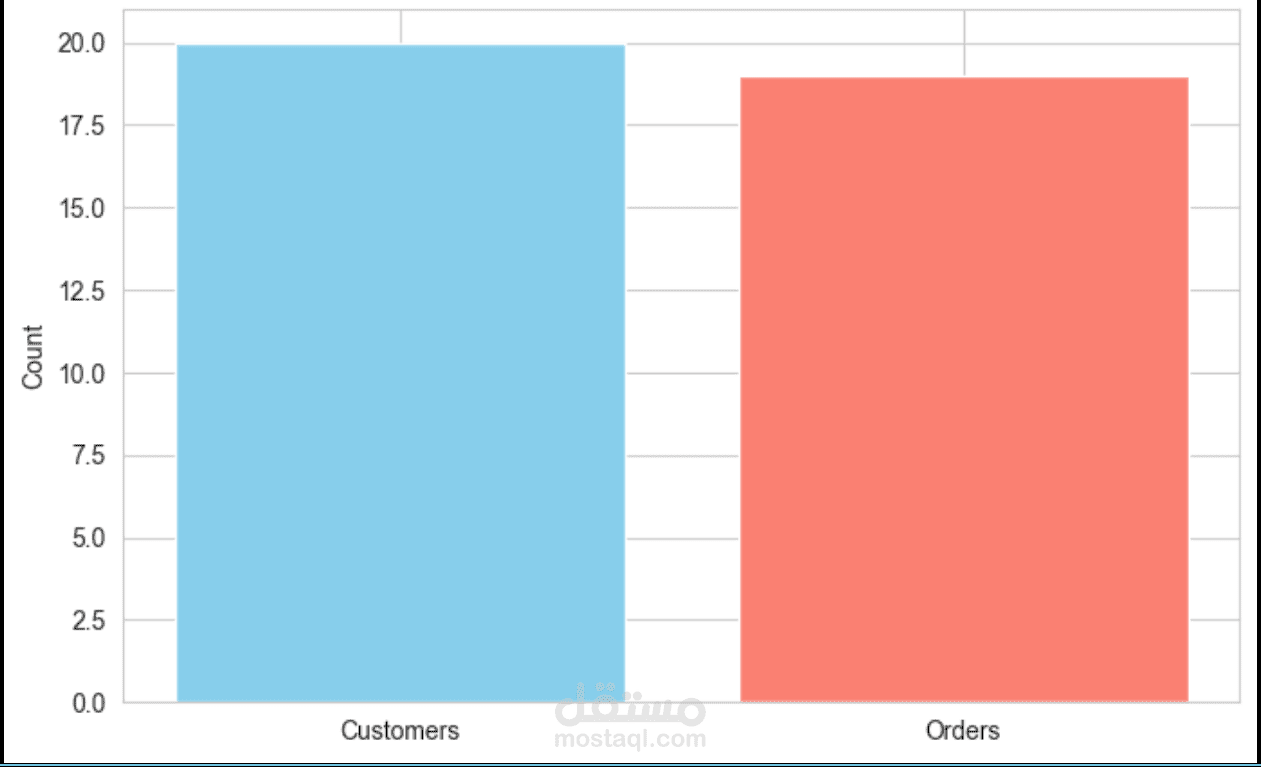
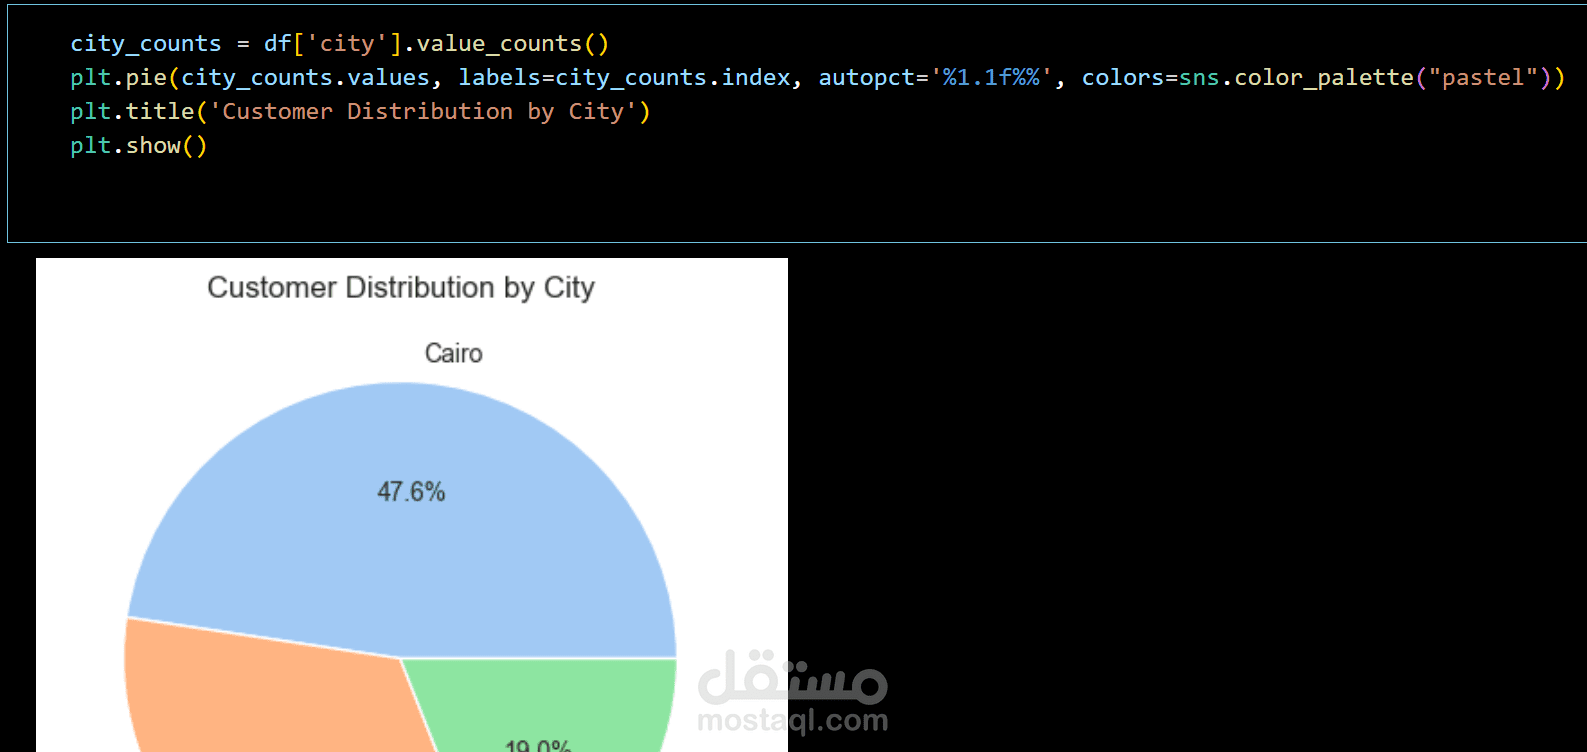
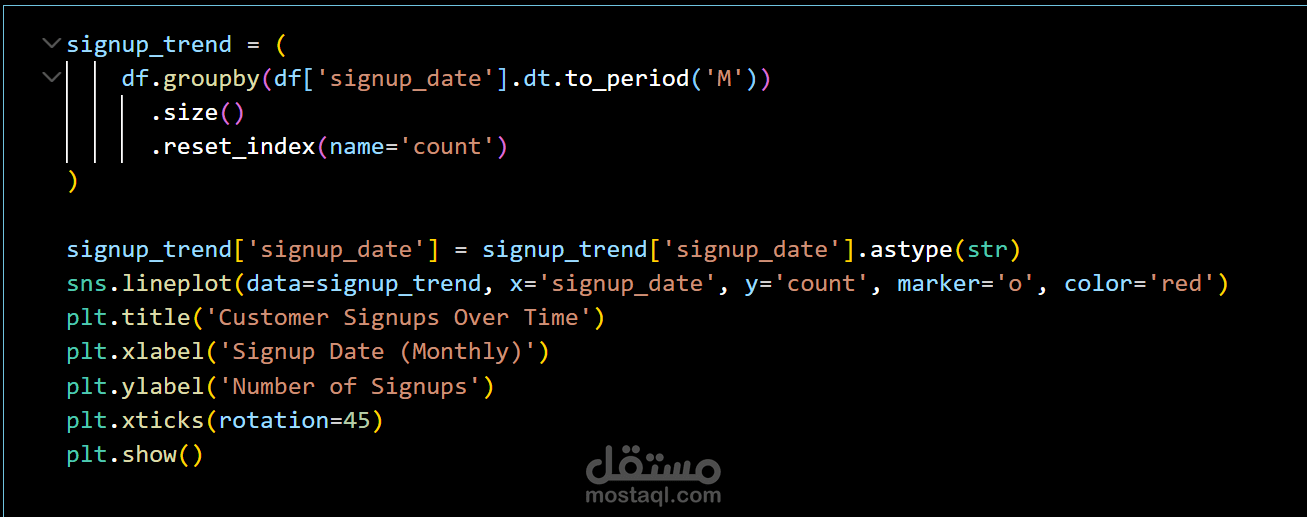
Created multiple data visualizations using Seaborn and Matplotlib to explore patterns and trends within structured datasets
Visualizations included bar charts, line plots, and heatmaps to support data understanding and insight generation