Vehicle Utilization Dashboard
تفاصيل العمل
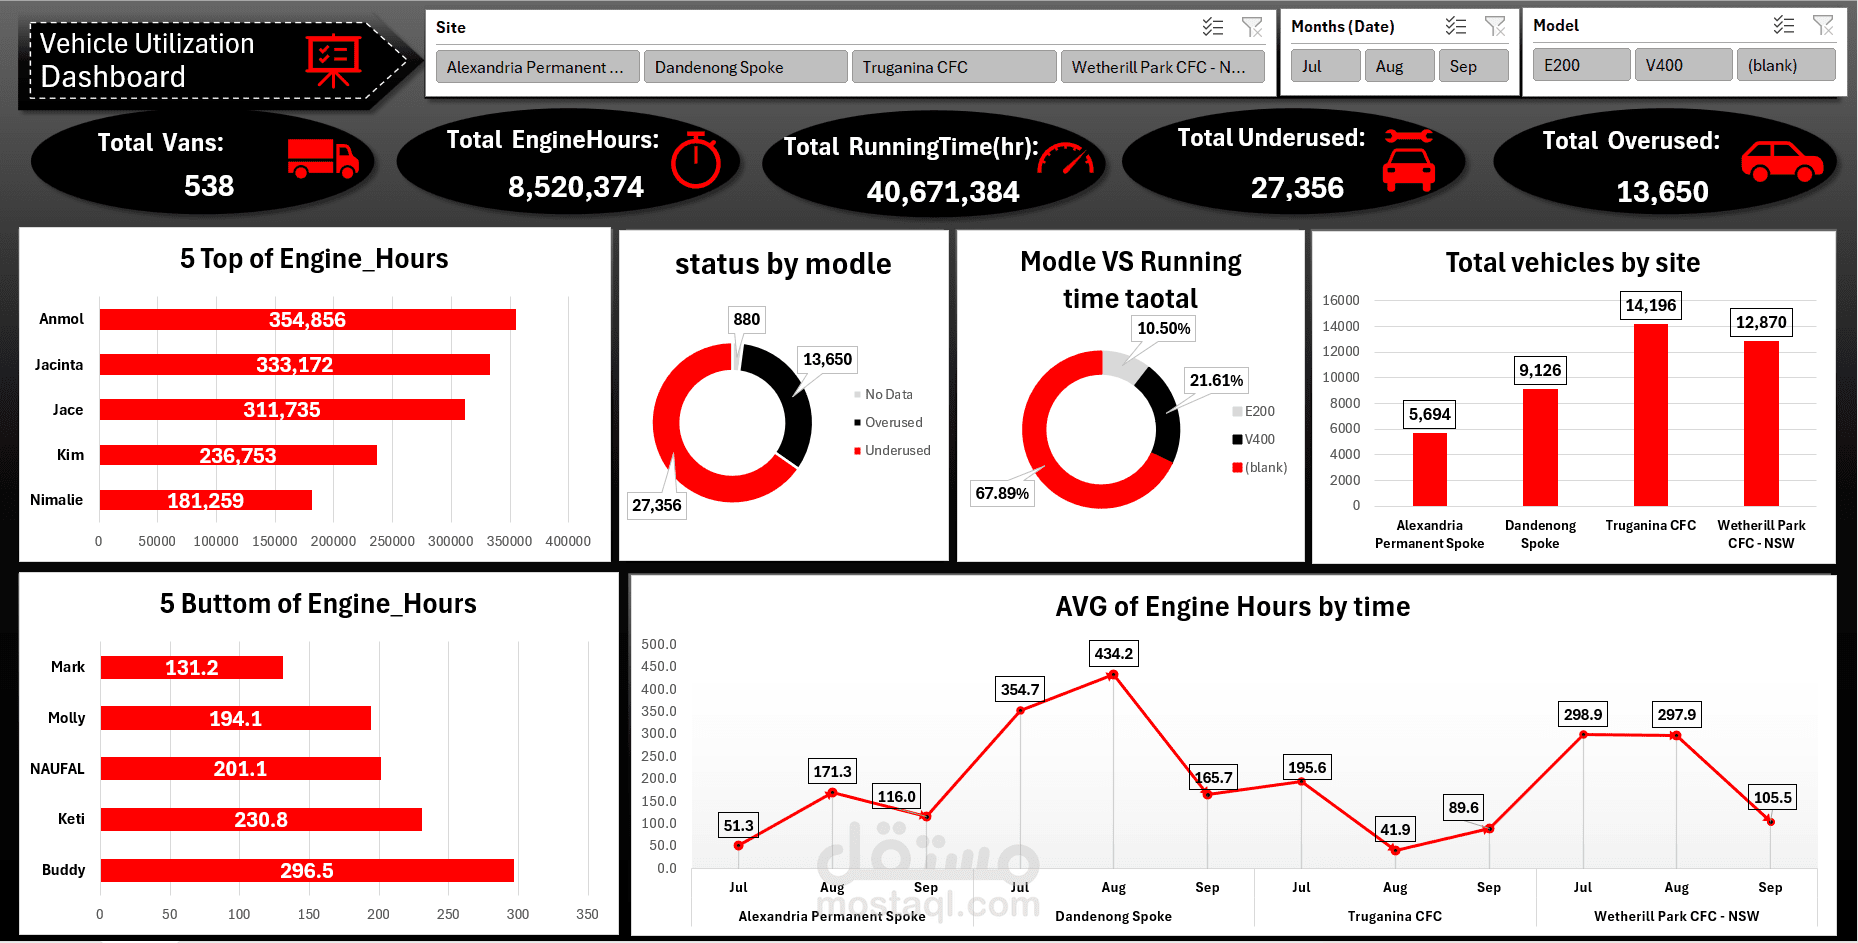
I designed a Vehicle Utilization Dashboard using Microsoft Excel to monitor fleet performance and operational efficiency
The dashboard presents key KPIs such as Total Vans, Total Engine Hours, Total Running Time, Underused, and Overused vehicles
It highlights the top and bottom 5 drivers based on engine hours to evaluate performance
A status breakdown by model shows the distribution of underused and overused vehicles
It also compares models against total running time to identify utilization patterns
Vehicle distribution by site is visualized to assess operational load across locations
Interactive slicers for site, month, and model allow dynamic filtering and deeper data analysis