Sales Insights & Customer Behavior Analysis
تفاصيل العمل

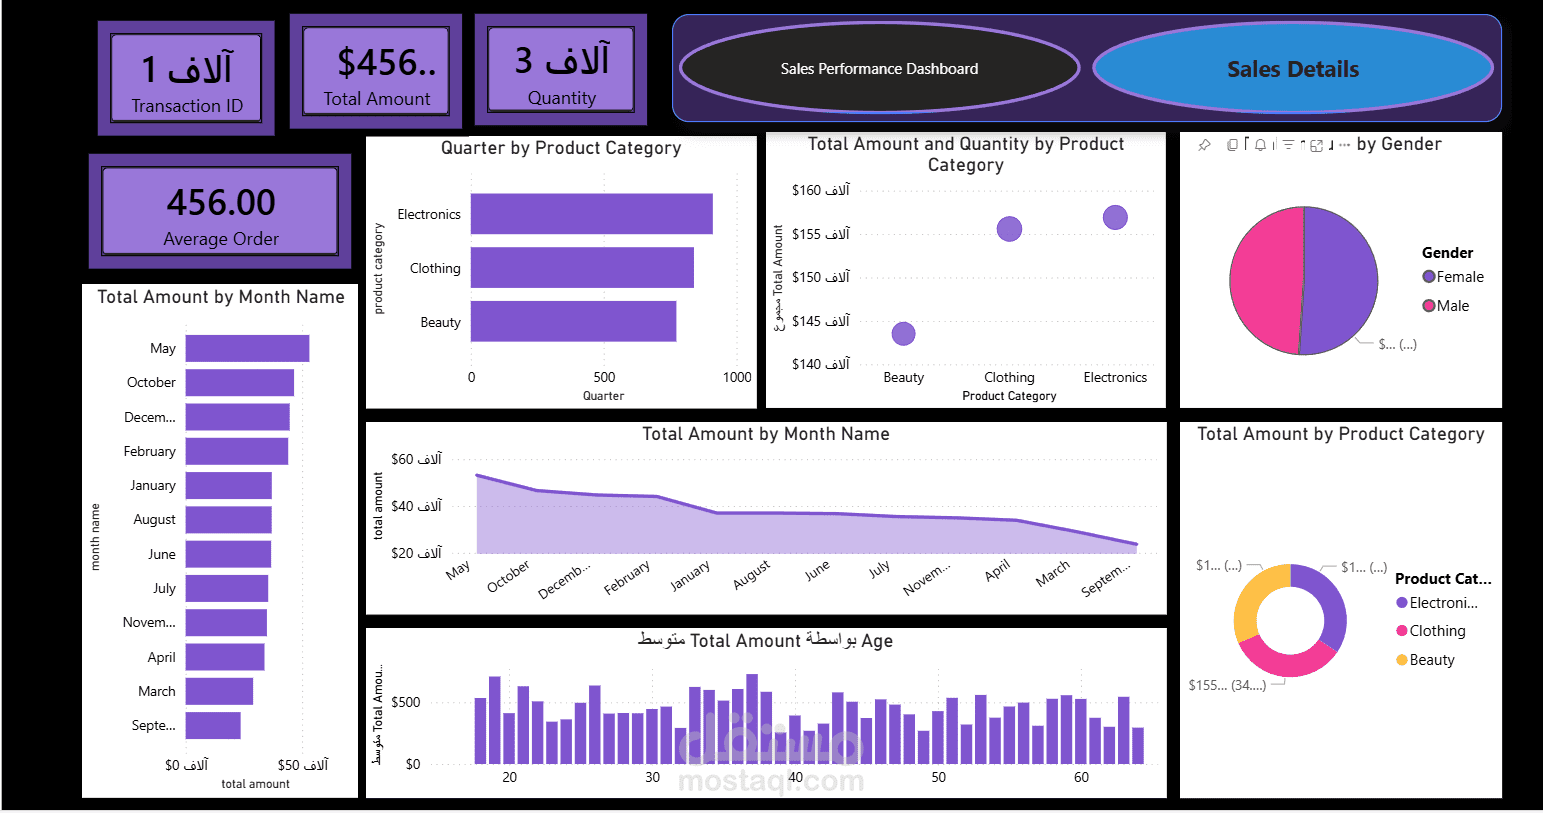
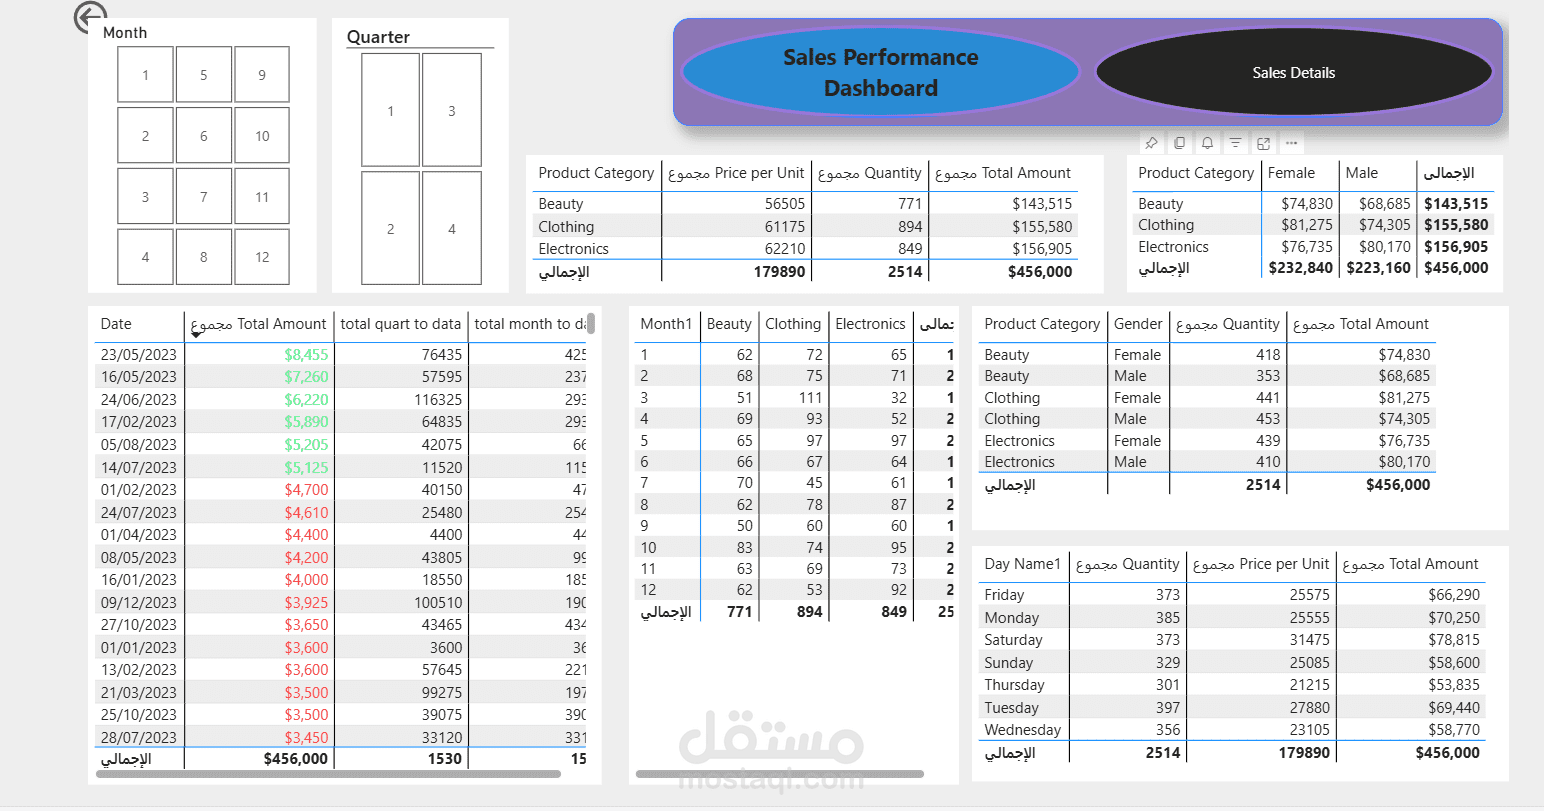
This project focuses on analyzing retail sales data using Excel and Power BI. The data was cleaned, transformed, and modeled to build an interactive dashboard that highlights key performance indicators, sales trends, customer spending behavior, and product performance. Time-based analysis such as monthly comparisons and growth rates was implemented to provide deeper business insights. The final dashboard allows users to explore sales performance and make data-driven decisions.
وصف المشروع (العربية)
يركز هذا المشروع على تحليل بيانات مبيعات التجزئة باستخدام Excel وPower BI. تم تنظيف البيانات ومعالجتها وبناء نموذج تحليلي لإنشاء لوحة تحكم تفاعلية تعرض مؤشرات الأداء الرئيسية، واتجاهات المبيعات، وسلوك إنفاق العملاء، وأداء المنتجات. تم تنفيذ تحليلات زمنية مثل المقارنات الشهرية ومعدلات النمو لاستخراج رؤى أعمق لدعم القرارات. تتيح لوحة التحكم النهائية استكشاف أداء المبيعات واتخاذ قرارات مبنية على البيانات.
? Project Goal (English)
The goal of this project is to transform raw sales data into meaningful insights through data cleaning, modeling, and interactive visualization. The dashboard helps understand sales performance, customer behavior, and business trends to support better decision-making.
? هدف المشروع (العربية)
يهدف هذا المشروع إلى تحويل بيانات المبيعات الخام إلى رؤى مفيدة من خلال تنظيف البيانات وبناء نموذج تحليلي وتصميم لوحة تحكم تفاعلية. تساعد هذه التحليلات في فهم أداء المبيعات وسلوك العملاء والاتجاهات التجارية لدعم اتخاذ القرارات بشكل أفضل.