E-Commerce Performance Dashboard — EcomEdge
تفاصيل العمل
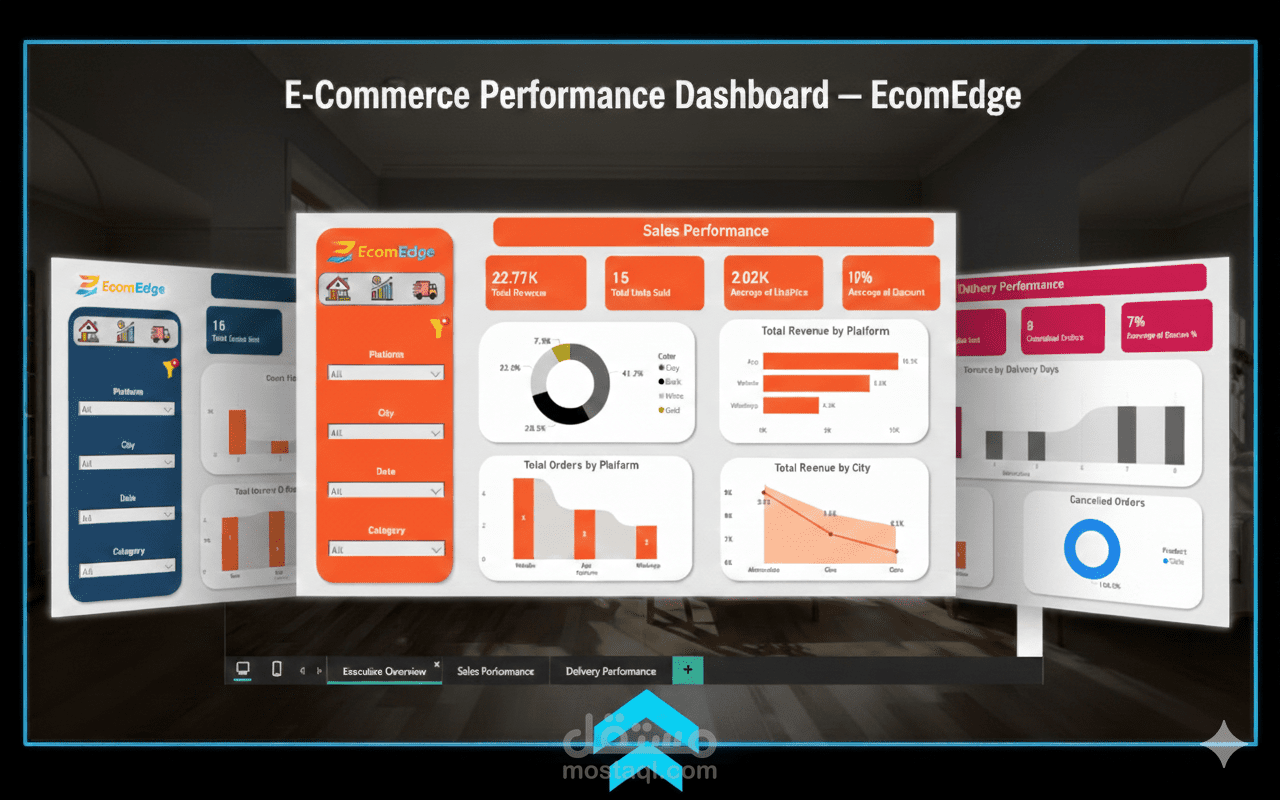
Overview--
This project focuses on analyzing e-commerce performance through an interactive Power BI dashboard designed to provide executives with a clear overview of sales and delivery operations. The dashboard transforms transactional data into actionable insights that support operational and strategic decision-making.
Business Problem--
E-commerce businesses generate large volumes of operational and sales data across multiple platforms. The challenge was to consolidate this data into a single interactive report that allows management to monitor revenue, order performance, delivery efficiency, and cancellation rates in real time.
Dataset--
The dataset represents e-commerce transactional data including orders, products, delivery performance, sales channels, and customer distribution. The data was structured to simulate real-world business reporting scenarios.
Tools Used--
Power BI
Data Modeling
DAX Measures
Interactive Dashboard Design
Data Visualization Best Practices
Dashboard Structure--
The dashboard consists of three main pages:
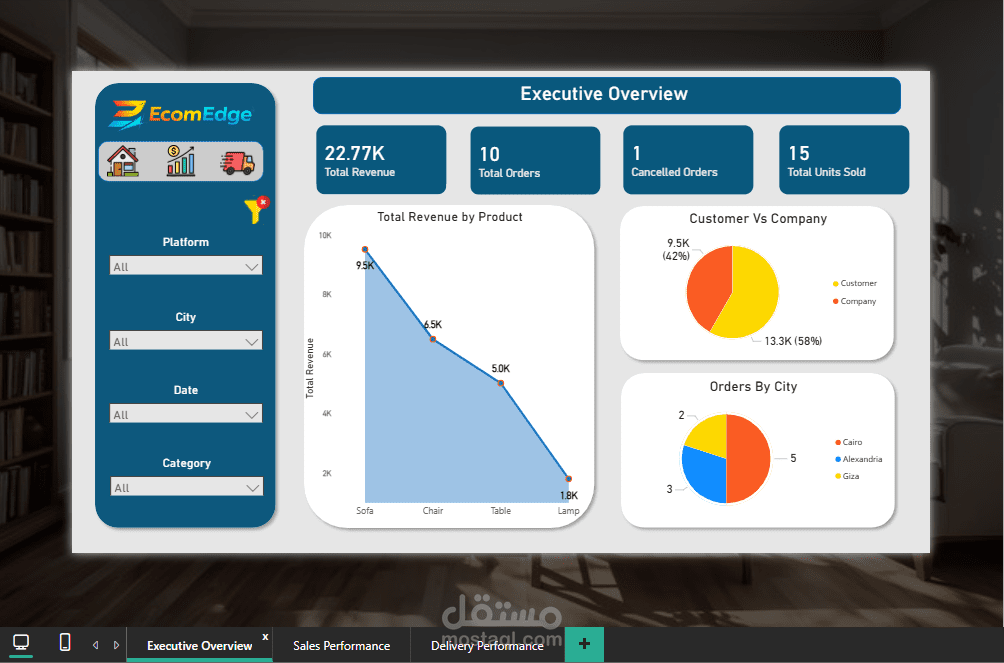
Executive Overview--
Total revenue and order KPIs
Revenue by product analysis
Sales distribution by city and sales channel
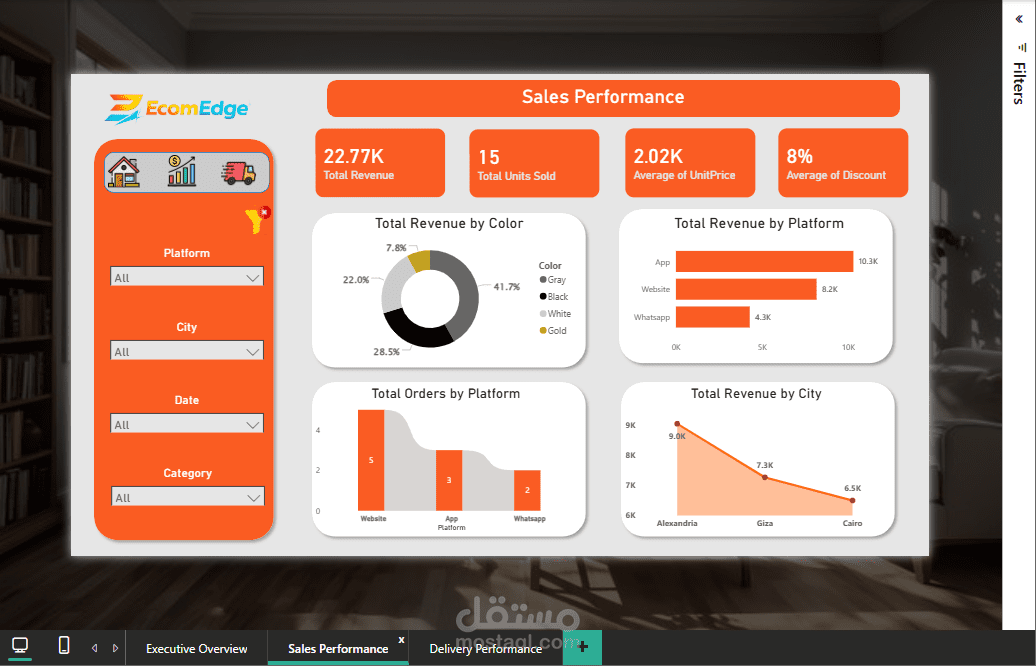
Sales Performance--
Revenue breakdown by platform
Product and category performance
Revenue distribution analysis
Interactive filtering by platform, city, and date
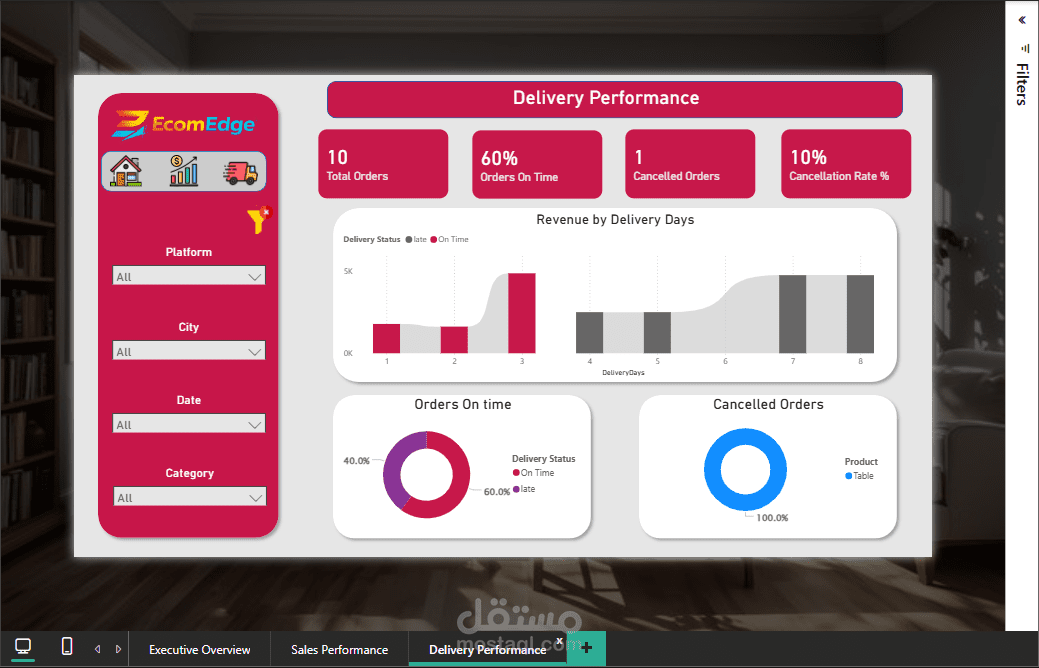
Delivery Performance--
Orders on-time vs delayed
Cancellation rate monitoring
Revenue analysis by delivery duration
Operational performance tracking
Key Insights--
Revenue is concentrated in a limited number of product categories.
Sales performance varies significantly across platforms.
Delivery delays directly impact cancellation rates.
Certain cities generate higher order volumes but lower delivery efficiency.
Business Recommendations
Optimize delivery operations in high-demand cities.
Focus marketing efforts on high-performing platforms.
Monitor cancellation drivers to improve customer satisfaction.
Use delivery performance metrics to improve operational planning.
Future Improvements--
Add time-based trend analysis for revenue forecasting.
Connect dashboard to live data sources for automated refresh.
Introduce performance comparison with previous periods.