Sales Data Visualization Using Excel Charts
تفاصيل العمل

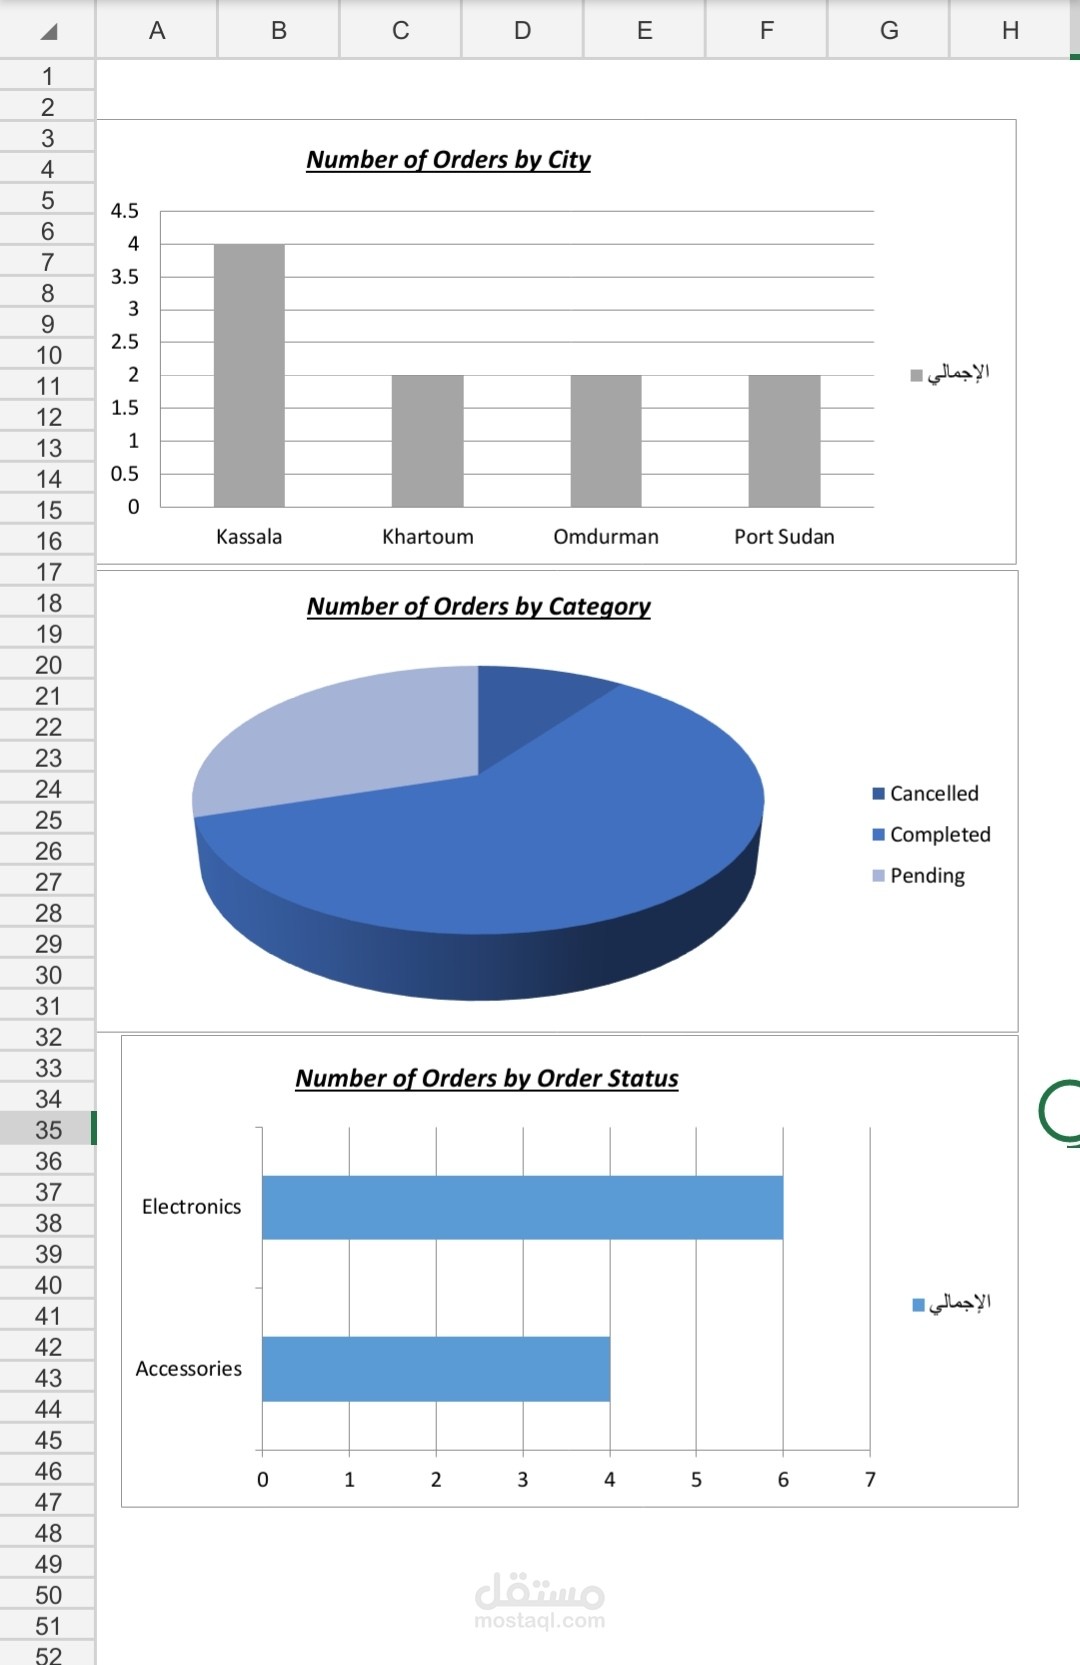
This project focuses on presenting sales data visually using charts linked to Pivot Tables.
It includes:
Column, Pie, and Bar charts.
Clear titles and labels.
Professional formatting.
Dynamic visuals that update automatically.
This work demonstrates strong data presentation and dashboard-style reporting skills.